What is the Vertical Recon Tape?
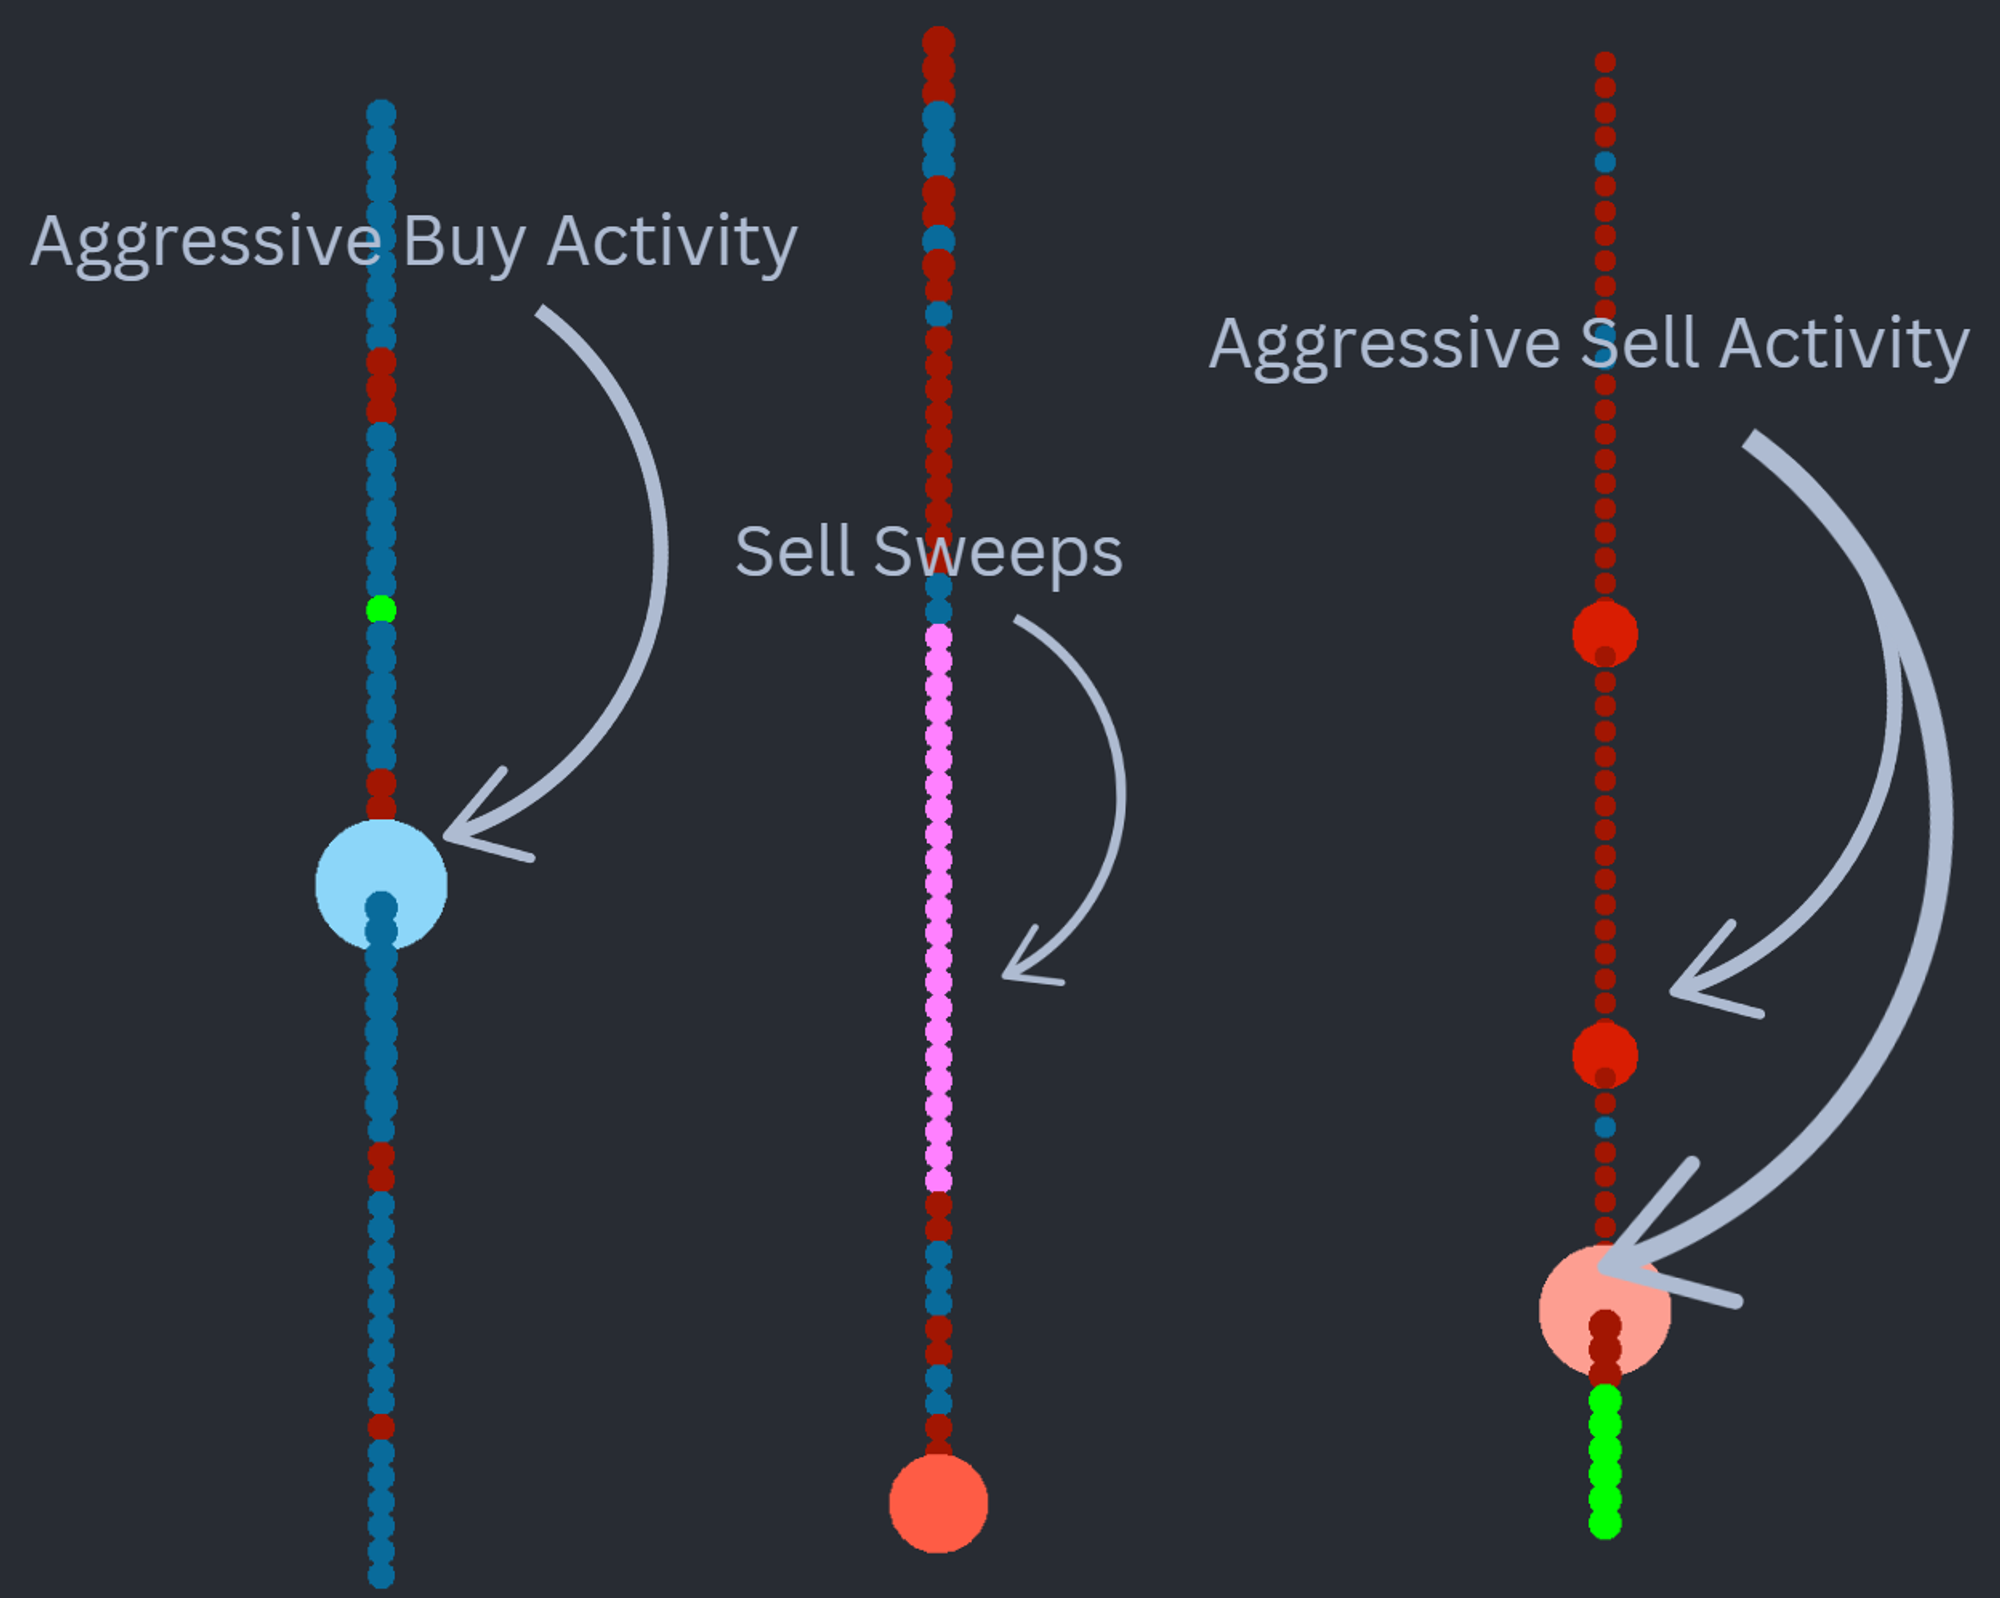
The Vertical Recon Tape converts Time & Sales data into a clean visual feed using bubbles whose size and color reflect trading activity. Bubble dimensions correspond to size traded; color intensity ramps from dark to bright (red for sells, blue for buys) as participation becomes more aggressive. Multi-level prints — sweeps — render in their own distinct color so they cannot be missed.
Who it's for
- Order flow traders on ES, NQ, CL, GC and other futures who scalp or swing intraday
- OFL users who want a more readable alternative to the standard Time & Sales window
- Traders who key off sweeps, aggression shifts and absorption at points of interest
- Discretionary traders pairing tape reading with structure (Job Pivots, Dominator, Delta Map)
- New traders learning to interpret aggressive participants without drowning in raw prints
How the Vertical Recon Tape works
The study renders one bubble per qualifying transaction, vertically stacked in time order. Two visual dimensions encode order flow context.
Bubble size — order size
Bubble size scales with the size of the executed order, so large prints visually dominate small retail flow. The eye is drawn to size first, which is the right priority for tape reading.
Color gradient — direction and aggression
Color gradient moves from muted to bright. Bright red signals aggressive selling into the bid, bright blue signals aggressive lifting of the offer. As the gradient shifts darker, you are seeing smaller, less aggressive participants step in. Direction and aggression are encoded together, so you can read them in a single glance.
Sweep detection
Sweep detection is built in. When a single order clears multiple price levels, the tape paints those bubbles with a separate color scheme so traders can distinguish a true liquidity sweep from a stack of independent prints.
A peripheral read
The result is a tape you can read peripherally while keeping focus on price structure — the design goal of the study.
Setup & installation
- Install the OrderFlowLabs package and load the included chartbook supplied with your subscription.
- Apply the Vertical Recon Tape study to a dedicated chart panel.
- Set the chart to a 24-hour session anchored to your preferred Globex open.
- Configure data settings to one trade per bar and limit data loading to one day.
- Avoid loading excessive tick history — performance and refresh rate degrade with oversized datasets.
- Tune chart display refresh rate to your hardware for smooth real-time playback.
For a full walkthrough, watch the Vertical Recon Tape installation guide.
Note: Platform-specific videos for MotiveWave, NinjaTrader, and EdgeProX are provided in the Discord.
Example use case
Price drifts down toward a Job Pivot from above. On the Vertical Recon Tape you see a stack of large bright-red sweep bubbles that stalls inside the zone, generating a heavy negative delta footprint without follow-through. That stall on aggressive selling is your read: aggressive sellers were absorbed at support. You can either initiate the long during that absorption print or wait for an acceleration away from the zone and enter on the retest, using the tape's footprint as your trigger context.