What is Dominator?
Dominator is an execution-grade order flow study that monitors the auction tick by tick and pinpoints material shifts in aggression as they happen. When buyers are leaning hard into the offer with size and speed, an up arrow prints. When sellers are pressing the bid with the same disproportionate force, a down arrow prints. The thresholds are calculated by an OFL proprietary algorithm tuned for futures markets.
Who it's for
- Discretionary futures traders who want real-time confirmation at structural levels.
- Order flow traders fading or trading with aggression at LVNs, VWAP, and session pivots.
- Scalpers and intraday traders on ES, NQ, CL, and other liquid CME products.
- Mechanical or hybrid traders looking for a clean, rule-based aggression filter.
- Existing OFL users layering execution signals onto AutoPlot, Buy/Sell Zones, and ATR Ranges.
How Dominator works
Pace, size, and intensity
Most order flow tools look at a single dimension — usually delta or volume. Dominator combines three: how fast trades are arriving, how large they are, and how aggressively the dominant side is crossing the spread. When all three exceed proprietary thresholds simultaneously, the study qualifies the move as a dominance event.
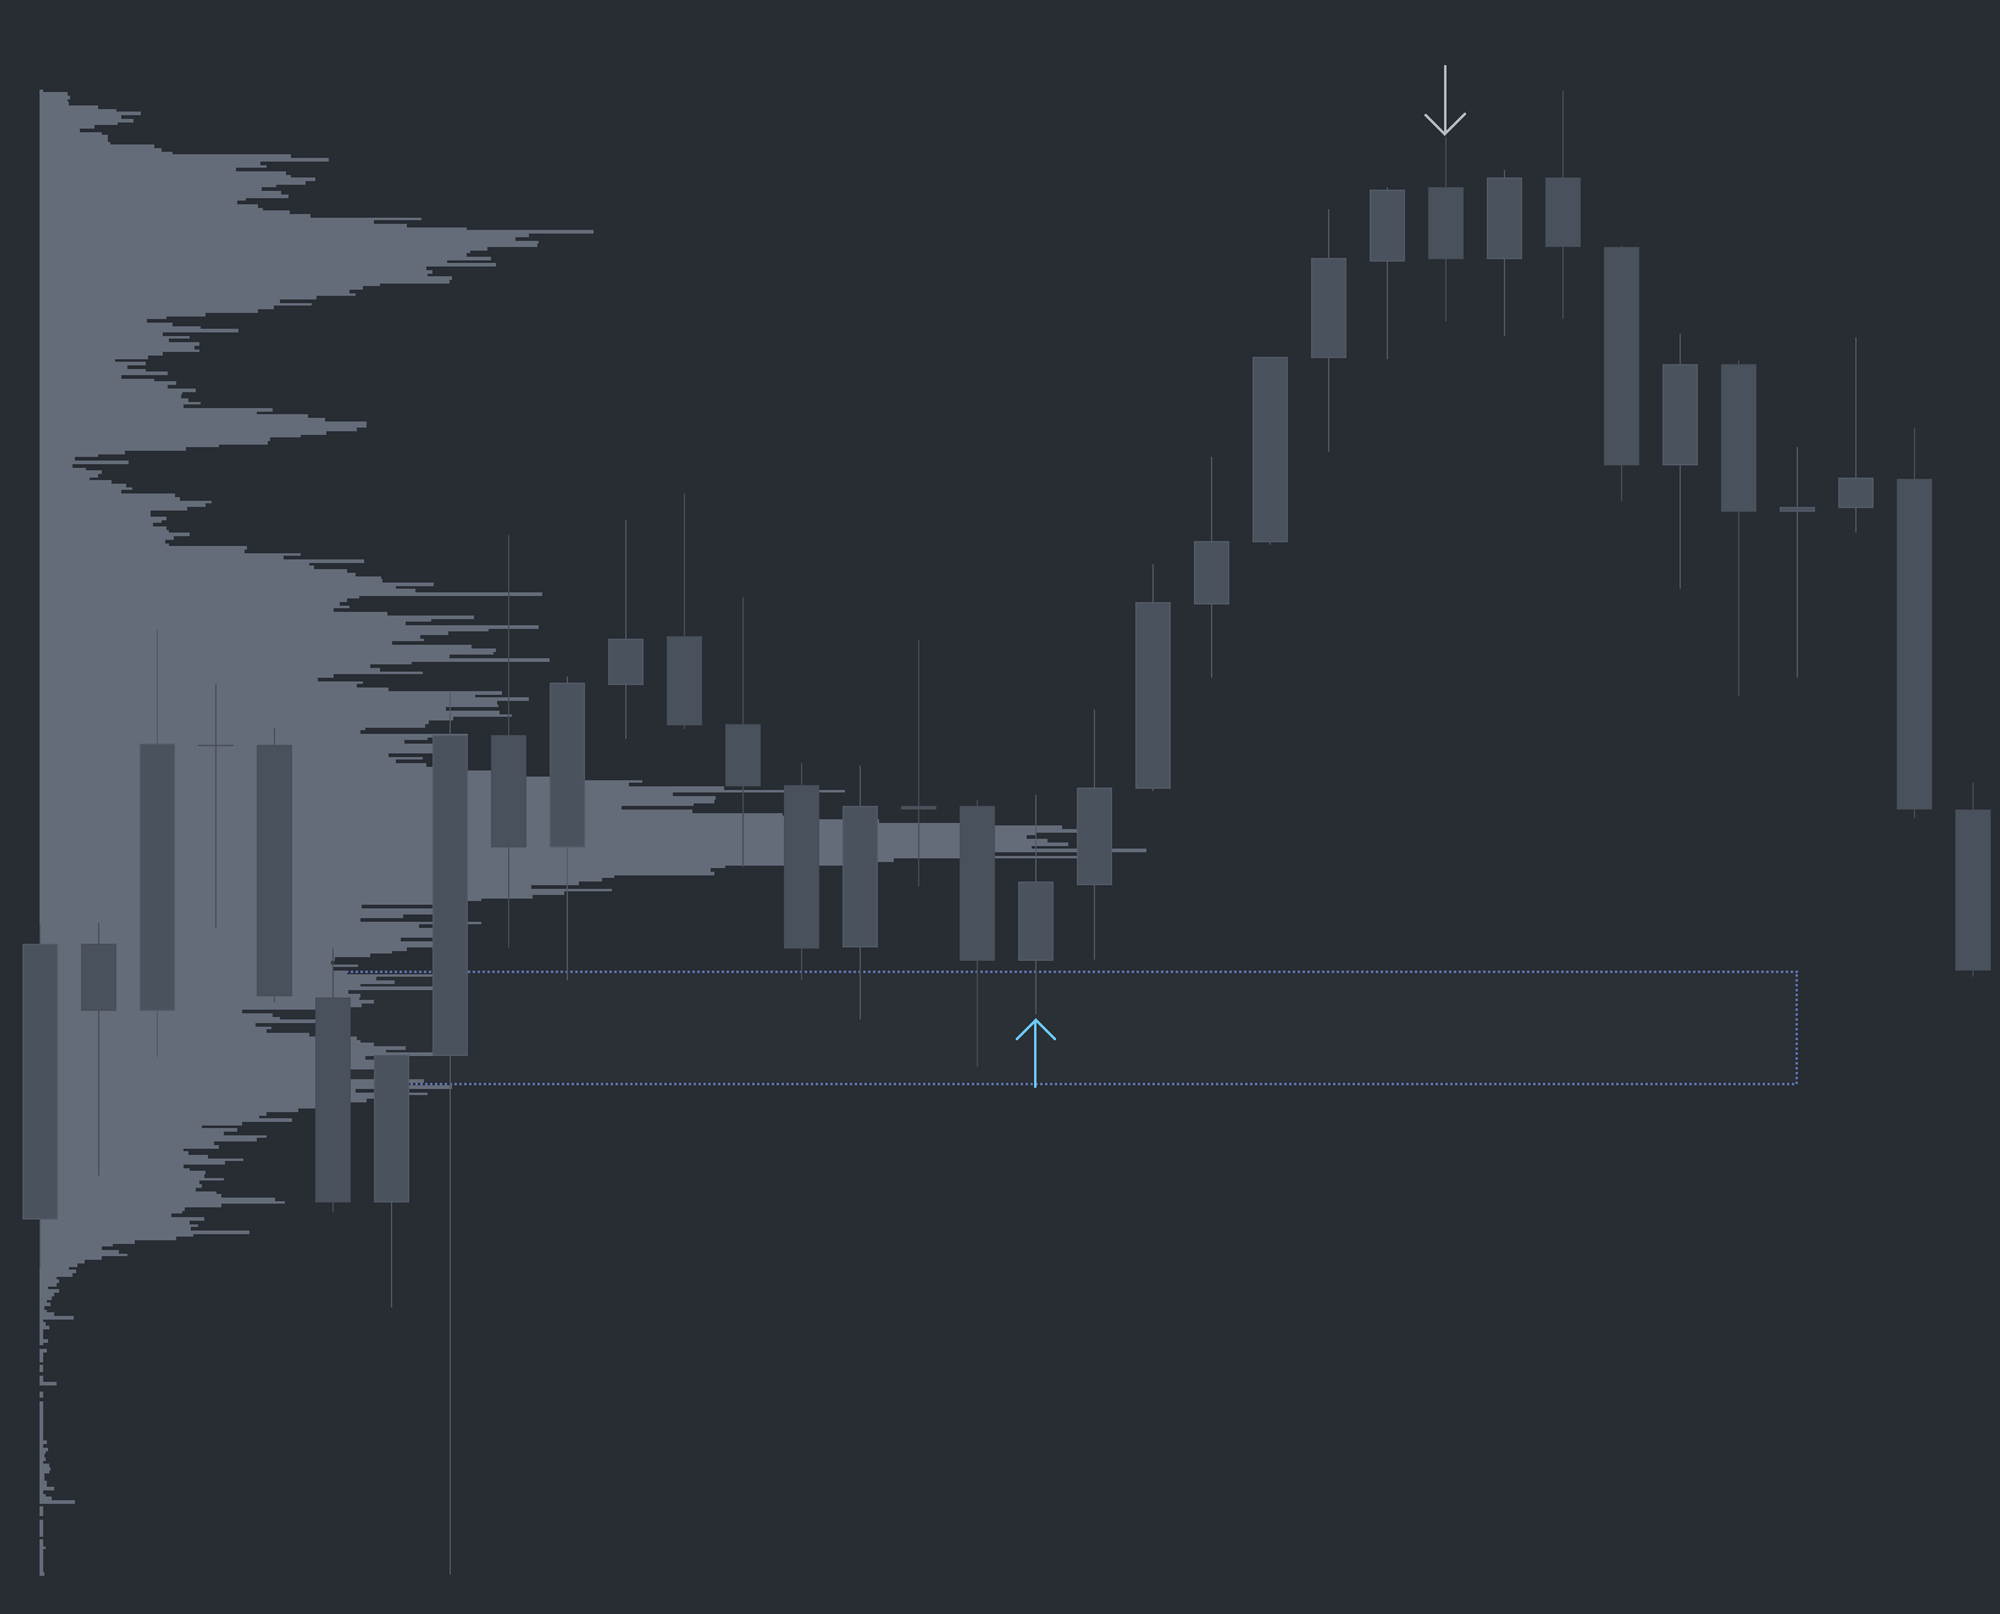
Directional arrows
A buy-side dominance event paints an up arrow at the price where it occurred. A sell-side event paints a down arrow. Arrows are non-repainting and print in real time as conditions are met.
Use as confluence, not as a standalone signal
Dominator alone is not a trade trigger. Like every OFL execution study, it is built to confirm or invalidate a thesis you already have at a key level. Examples of structural references that pair well with Dominator include Low Volume Nodes (LVNs), Session Value Pivots, Target Lines, VWAP, TWAP, Weekly Open, prior day OHLC, and OFL Buy and Sell Zones.
Setup and installation
- Install the OFL package in a supported platform of your choice (Sierra Chart, MotiveWave, NinjaTrader, or EdgeProX).
- Apply the Dominator study to your execution chart (typically a tick or volume bar chart on your primary instrument).
- Load the recommended Dominator settings. Tuning is rarely needed — defaults are calibrated for liquid CME futures.
- Pair the study with your structural chart so arrows can be read in the context of LVNs, VWAP, and session levels.
Watch the Sierra Chart setup guide: Dominator Installation (Sierra Chart). The chartbook and configuration files are included with the OFL package.
Note: Platform-specific videos for MotiveWave, NinjaTrader, and EdgeProX are provided in the Discord.
Example use case
Assume a prominent LVN exists from 3555 to 3560 on ES, and price is approaching from above. As the market trades down to 3565, directly above the LVN, a buy-side Dominator arrow prints. That arrow signals buyers aggressively defending the LVN, confirming its probability of holding as support. A trader can use the LVN as the structural thesis and the Dominator arrow as the execution trigger to position long, with a stop placed below the LVN.