What is ATR Ranges?
ATR Ranges is an Average True Range study built by OrderFlowLabs and available on every OFL-supported platform — Sierra Chart, MotiveWave, NinjaTrader, and EdgeProX. It measures the average magnitude of price fluctuations over a configurable lookback — typically the last 5 or 10 sessions — and projects two adaptive lines onto the chart: an ATR High and an ATR Low. Together, these define the range the current session is statistically likely to travel within, given recent volatility behavior.
Who it's for
- Futures day traders who want a quantified read on expected daily range.
- ES, NQ, CL, and GC traders managing risk-reward against realistic session targets.
- Order-flow traders who use volatility context to filter setups near range extremes.
- Traders, MotiveWave, NinjaTrader, or EdgeProX who want adaptive ATR projections overlaid on their execution charts.
- Traders pairing structural levels (AutoPlot, ODR Zones) with a volatility framework.
How ATR Ranges works
Adaptive ATR calculation
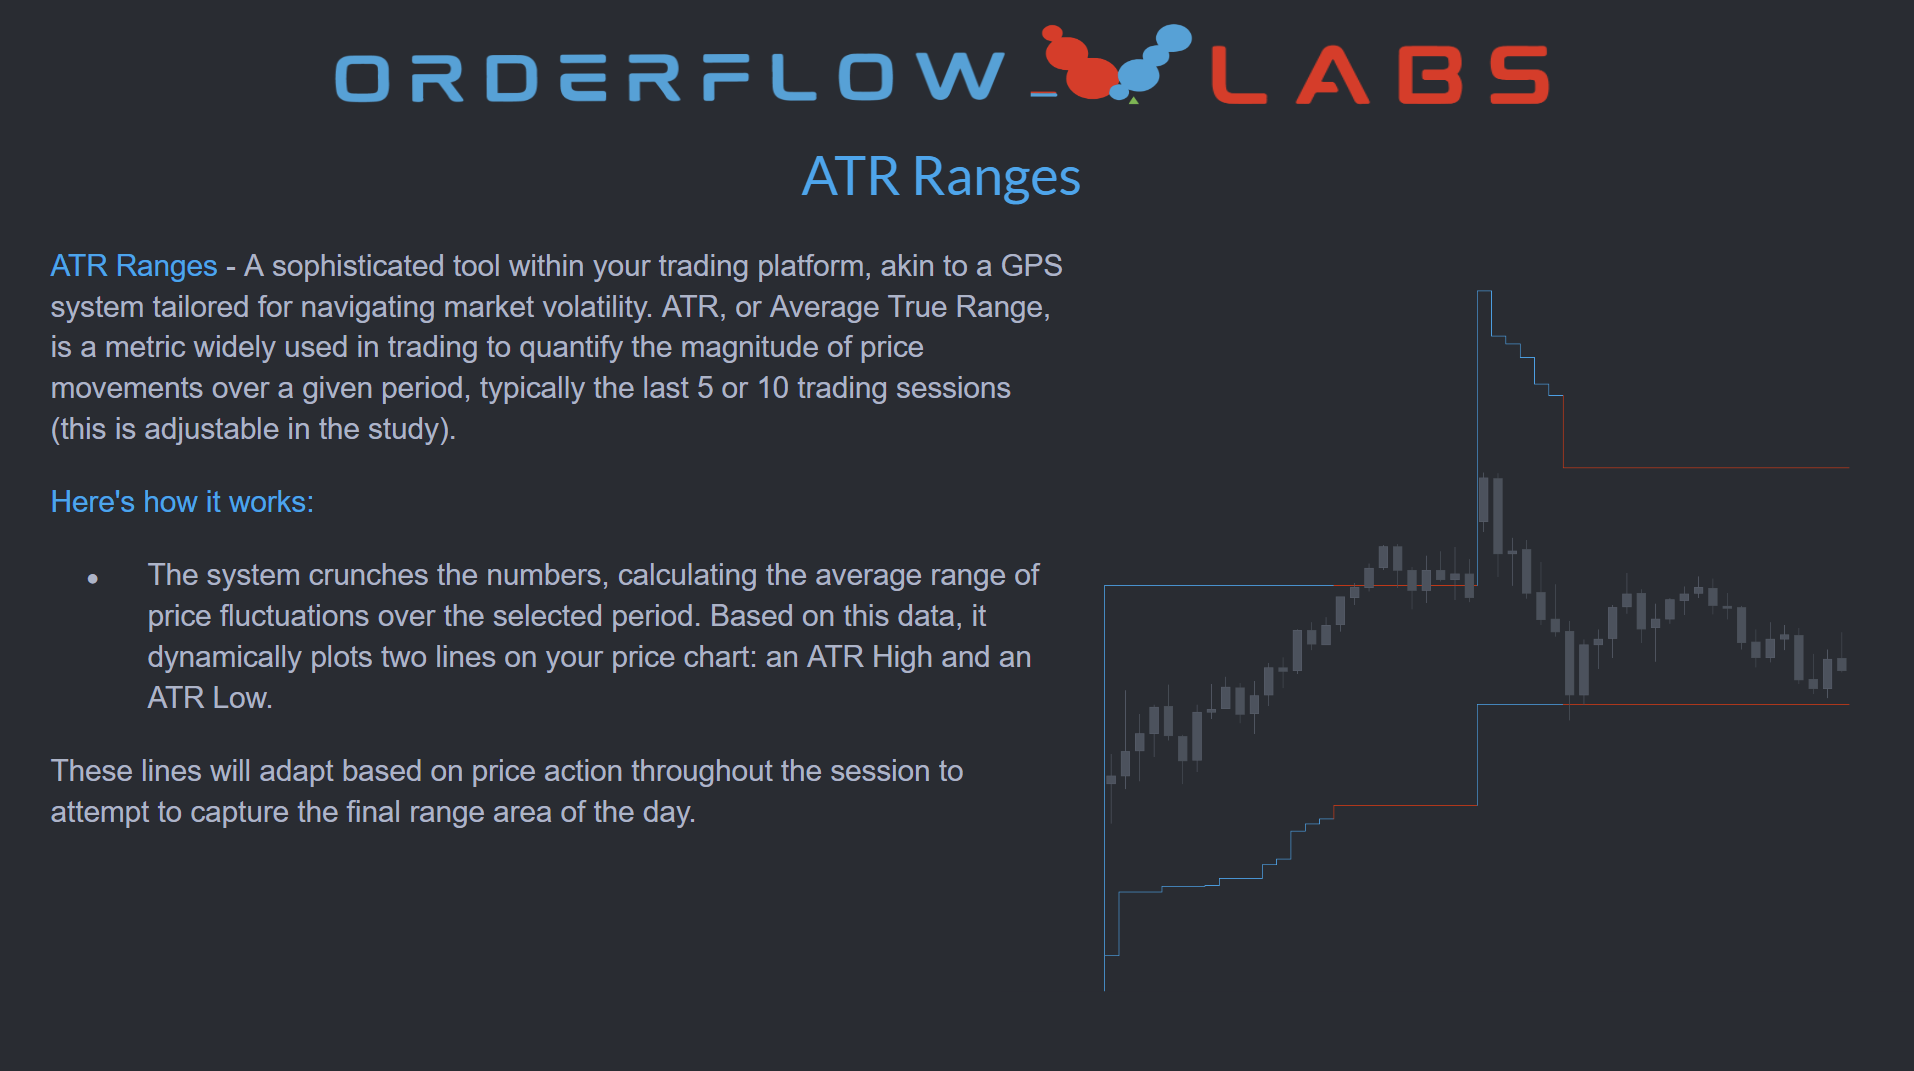
The study computes the average true range over the selected lookback period and uses that value to project an ATR High target and an ATR Low target for the current session. The lookback is adjustable so you can match the study to a contract's recent behavior.
Real-time adjustment
ATR High and ATR Low are not static lines. They adapt as price action unfolds during the session, giving you a live read on whether the market is approaching its expected upper or lower bound.
Context, not signals
ATR Ranges is a guide, not a trade trigger. As price approaches the ATR Low in a downtrend, traders typically reassess the risk-reward of new short entries; near the ATR High in an uptrend, the same logic applies in reverse. The study helps you spot when the day's range may be close to exhausted.
Setup and installation
ATR Ranges ships on every OFL platform and works the same on each. Most traders are running it inside a single session: load the pre-configured chartbook included with your OFL package to drop ATR High and ATR Low onto your charts immediately, or follow the platform-specific setup walkthroughs in the OFL Discord if you'd rather wire it up by hand.
Recommended configuration
| Setting | Recommended value | Notes |
|---|---|---|
| Bar period | 1, 5, or 15 minutes | Pick the period that matches your execution timeframe |
| Session timeframe | 24-hour session | Captures Globex + RTH for full ATR context |
| ATR lookback | 5 or 10 sessions | Configurable input — tune to instrument behavior |
The lookback period and session settings are universal across platforms. Everything else is handled by the OFL chartbook.
Example use case
ES has trended higher all morning and is now approaching the ATR High projected at the open. Rather than chasing strength into the upper bound of the day's expected range, you tighten up new long entries and start watching for momentum exhaustion through the OFL execution tools. If the market stalls and rotates, you have a defined level to lean against; if it breaks through cleanly, that itself is information about the day's character. ATR Low works the same way on the downside, reframing late-session shorts as lower-quality risk-reward.