What is the Market Efficiency study?
Market Efficiency is a study, visualized as an oscillator, that uses bid and ask volume to display the ratio of delta required to move price. The name reflects what it measures: efficiency of effort — how much aggressive volume the dominant side is spending to deliver a favorable price response. As efficiency lines cross, pinch or hit peak readings, traders get a structured framework for monitoring continuation versus reversal.
Who it's for
- Order flow traders on ES, NQ, RTY, CL, GC, UB and ZB
- Discretionary futures traders who want an objective read on bid/offer dominance
- Traders looking for confirmation alongside structure (Job Pivots, Buy/Sell Zones, MGI levels)
- Anyone running counter-trend setups who needs to filter low-quality entries
- OFL users comfortable with volume-charted bar types
How Market Efficiency works
The study renders multiple components on a single oscillator panel.
Market Efficiency line
A moving average of the volume-to-delta ratio. It tells you how efficient the active side is at moving price — the lower the ratio, the more delta is being spent for each tick of price progress.
Efficiency Mid, Min, and Max lines
Efficiency Mid Lines mark the midpoint of the Market Efficiency, providing a neutral reference for above/below readings. The Min/Max Line plots the previous swing high and low of Market Efficiency, anchoring relative-strength reads to recent extremes.
Efficiency Trigger Line and Crosses
The Efficiency Trigger Line is the average lookback Market Efficiency value used to generate delta-based signals. An Efficiency Cross fires when the Market Efficiency line crosses its Trigger Line — the operative event for continuation or reversal cues.
Pinch and failed pinch
When bid and offer efficiency lines pinch toward each other, you are seeing a battle for control. A clean cross with wide separation often kicks off a fresh leg; a failed pinch typically means the dominant side stays in command.
Setup & installation
- Install the OrderFlowLabs package and load the included Market Efficiency chartbook.
- Apply Market Efficiency to a volume-based bar chart on the 24-hour Globex session.
- Set volume per bar according to the instrument (see table below).
- Confirm the Trigger Line lookback and Mid/Min/Max settings match your trading style.
Recommended volume per bar by instrument
| Instrument | Symbol | Volume per bar | Session |
|---|---|---|---|
| E-mini S&P 500 | ES | 1,300 | 24-hour Globex |
| E-mini Nasdaq-100 | NQ | 500 | 24-hour Globex |
| E-mini Russell 2000 | RTY | 175 | 24-hour Globex |
| Crude Oil | CL | 375 | 24-hour Globex |
| Gold | GC | 135 | 24-hour Globex |
| Ultra T-Bond | UB | 175 | 24-hour Globex |
| 30-Year T-Bond | ZB | 420 | 24-hour Globex |
For a complete walkthrough, watch the Market Efficiency setup and description, the utilization and application video and the in-depth Market Efficiency webinar.

Example use case
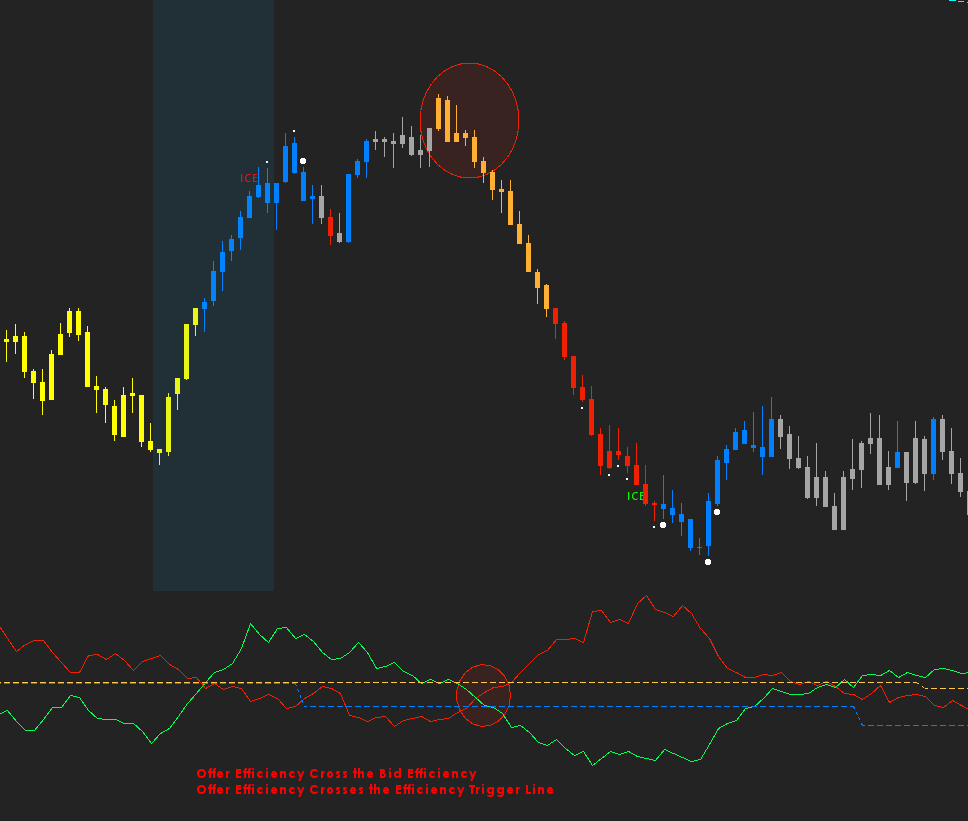
Offer Efficiency Cross. Price has been grinding higher into a swing high. Offer Efficiency crosses up through the Trigger Line near the high — the offer side is starting to deliver price more efficiently relative to delta spent. Combined with structural resistance, that cross flags a potential directional shift down.
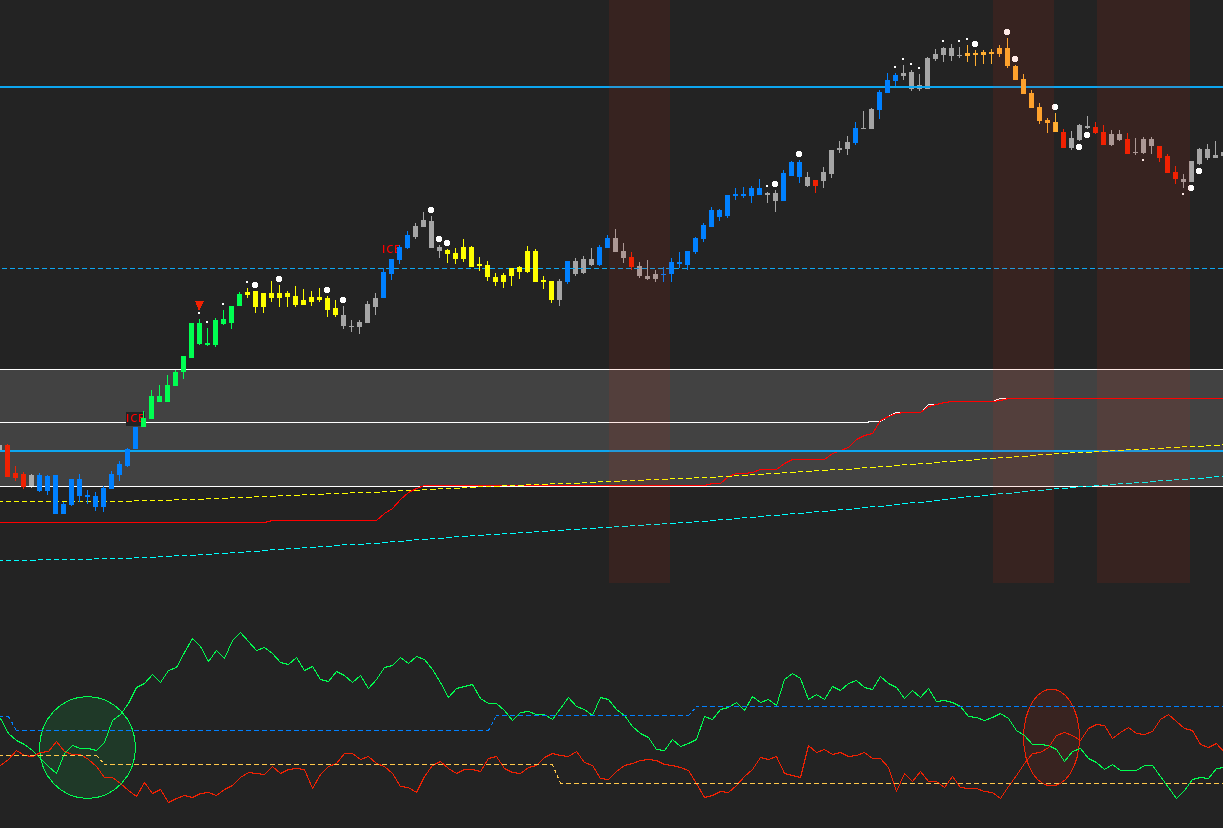
Bid Efficiency dominance with a failed pinch. Bid Efficiency stays in control through a pullback. Buyers attempt a pinch — Offer Efficiency rises toward Bid Efficiency — but never cross. The Bid stays dominant, keeping you in the trend trade and avoiding counter-trend tools that would otherwise fire on shallow signals.
Peak Efficiency. Offer Efficiency reaches a max efficiency point (on NQ, around 40%). At peak readings, the probability of a counter-rotation increases — useful as a fade or take-profit cue when paired with structure.