What is JOB Pivots?
JOB Pivots is a study that calculates an auction-based pivot from volume profile activity. The pivot acts as a Line in the Sand (LIS): a level that shifts directional bias depending on which side price is able to hold. Paired upper and lower targets project where the auction may slow, rotate, or extend. A second component — JOB Pivot Balance Zones — overlays multi-session pivot overlap into clean balance areas.
Who it's for
- Day traders working ES, NQ, CL, and other liquid futures
- Order-flow traders who anchor execution to a structural reference rather than a moving average
- Swing and position traders who want overlapping balance zones to define multi-day range
- Auction Market Theory practitioners building plans around responsive vs. initiative behavior
- OFL package users pairing pivots with Market Generated Information and execution tools
How JOB Pivots works
The session pivot and targets
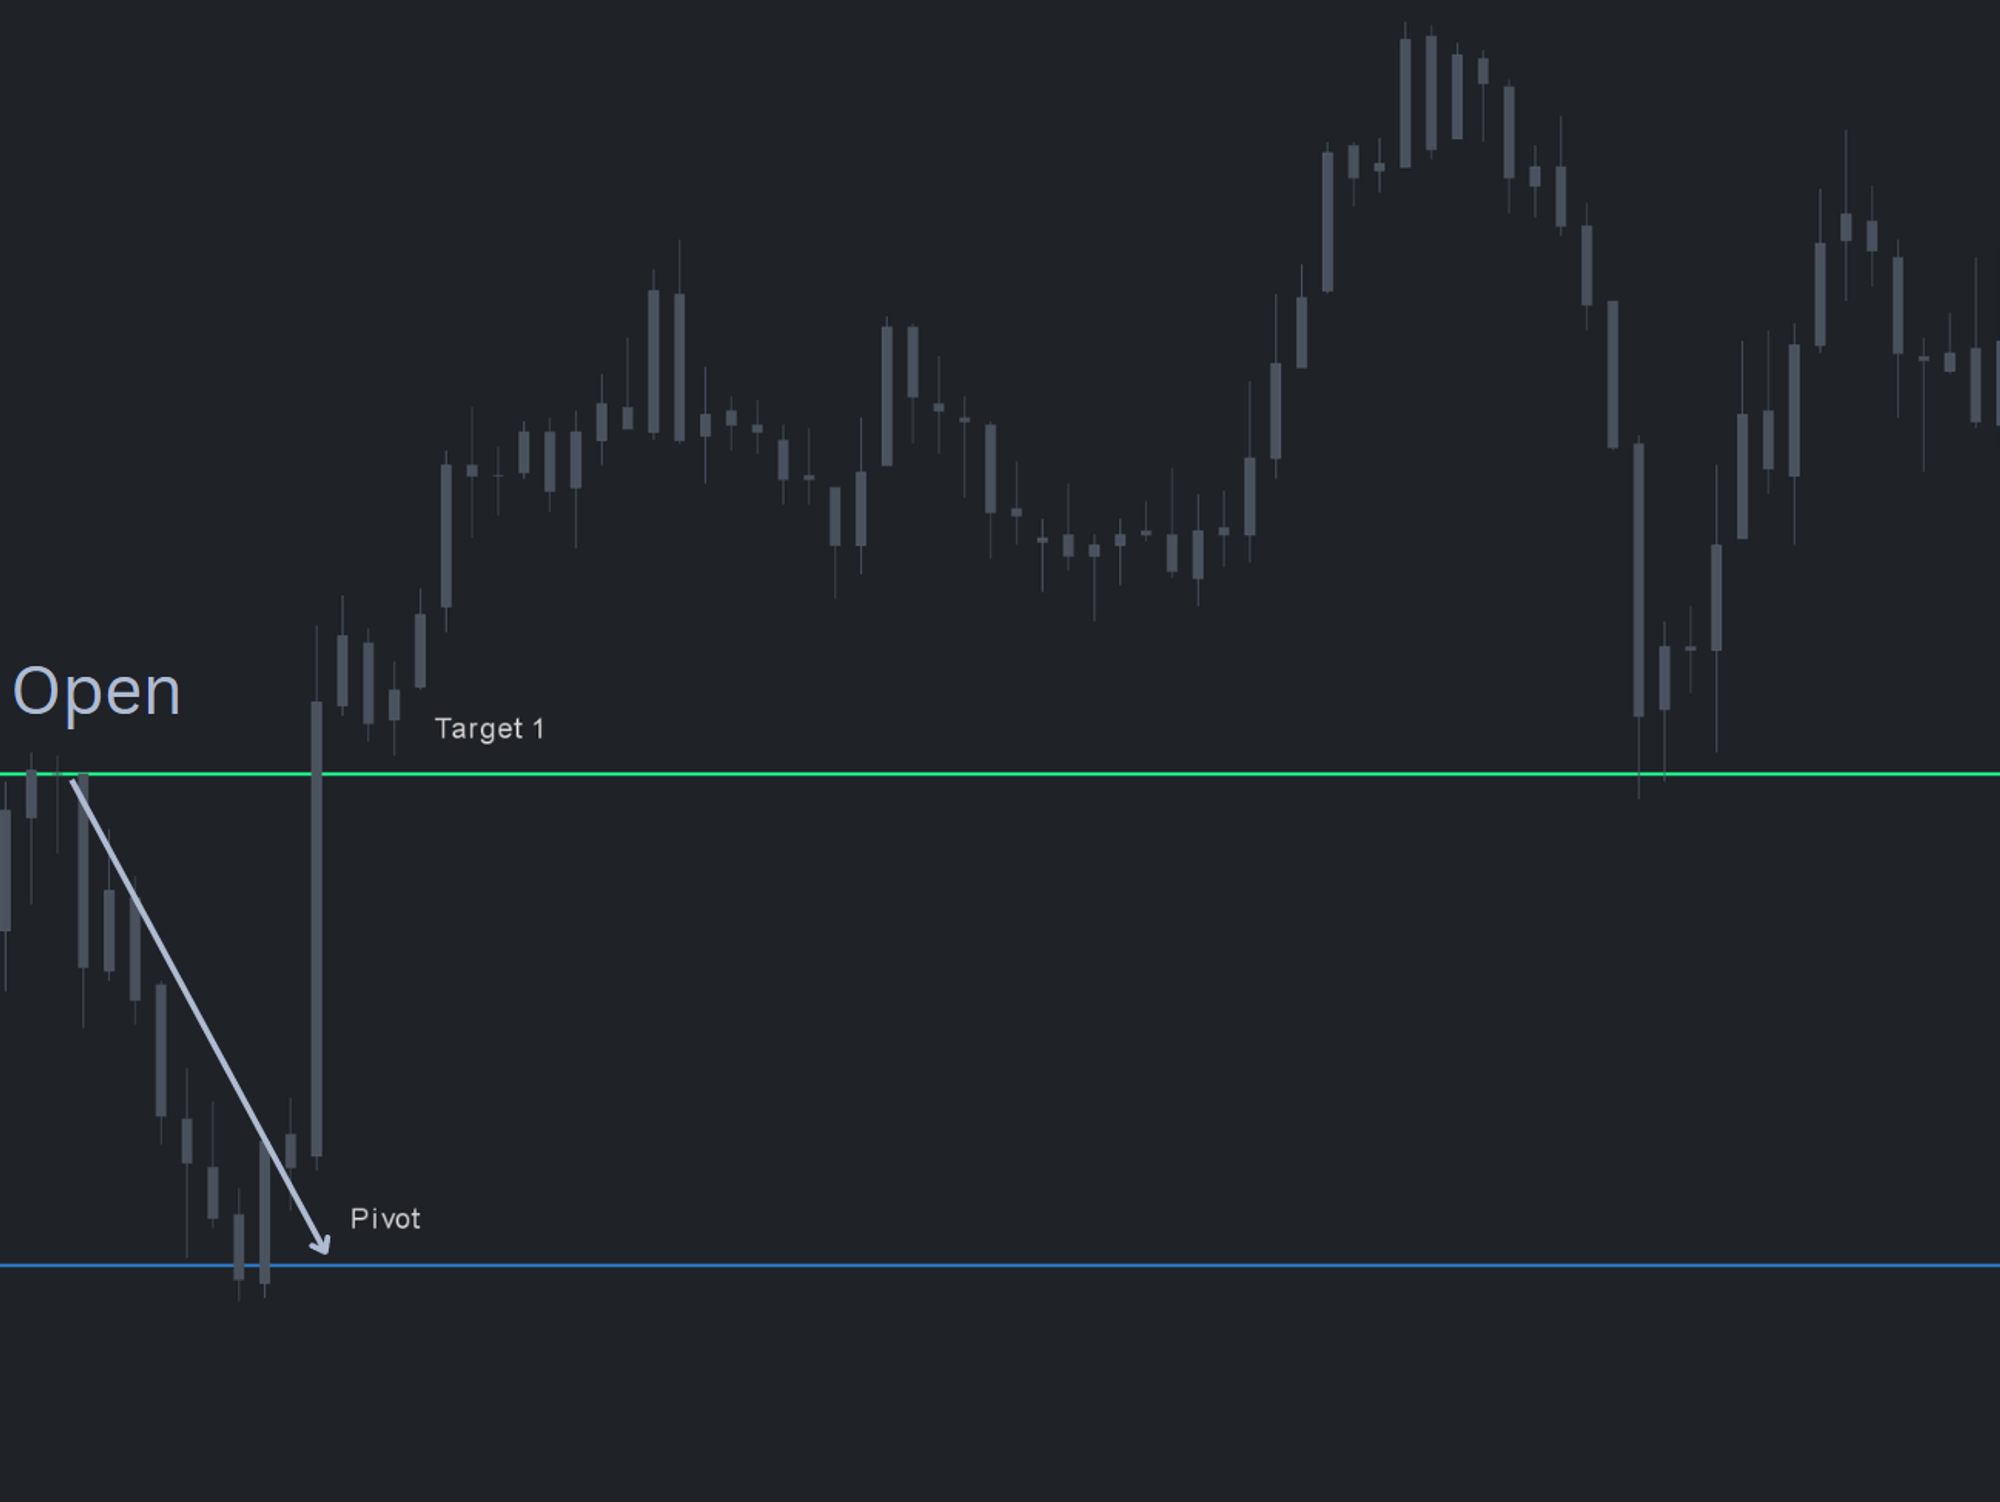
The pivot is rendered as a single horizontal line with target levels above and below. The line itself is the bias inflection — directional conviction shifts when price loses or reclaims it. The targets identify areas where rotation may stall or reverse. Because the level is derived from volume profile activity, the responsiveness is visible the moment it is plotted: large rotations consistently start and stop at the pivot.
Bias and planning workflow
Use the pivot to remove pre-market bias and frame the session. Above the pivot, prefer long setups into upper targets; below the pivot, work shorts toward the lower targets. Failed continuation through the pivot is itself a signal — a counter-direction trade often sets up when the auction cannot follow through.
JOB Pivot Balance Zones
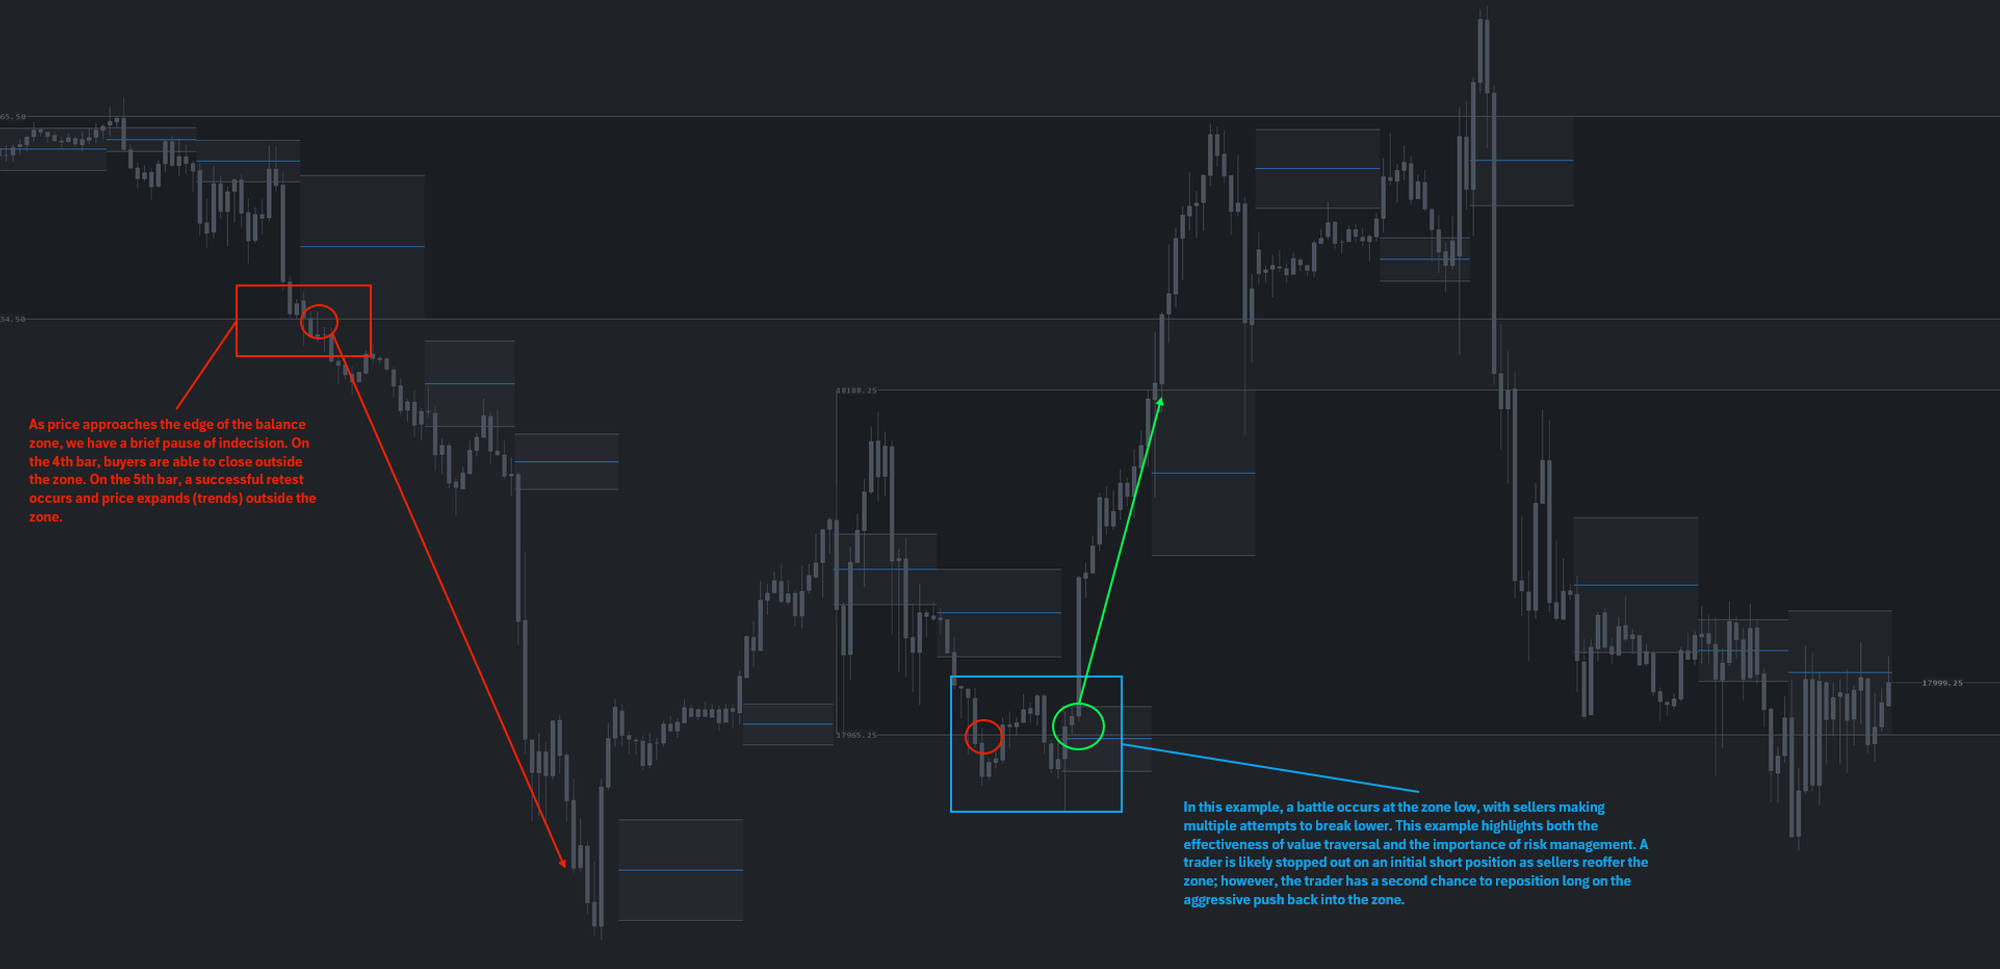
The Balance Zones component layers pivot ranges across a lookback window and renders the overlap as a balance area. Once overlap and time criteria are met, the zone persists on the chart and regroups automatically based on the study's lookback settings. Zones are reevaluated at each RTH open. Standard balance-zone logic applies: traversal expected when tempo and volume slow at the edge, expansion expected when pace and volume build heavy at the extreme.
Setup & installation
- Install the JOB Pivots study from the OFL package in a supported platform of your choice (Sierra Chart, MotiveWave, NinjaTrader, or EdgeProX).
- Apply the study to your primary execution chart.
- Add JOB Pivot Balance Zones to the same chart and set the lookback window to match your timeframe.
- Confirm the symbol is loading enough days of session data for the lookback to populate.
- Verify pivots and balance zones plot at the next RTH open.
Watch the JOB Pivots setup guide and the JOB Pivot Balance Areas setup guide. A chartbook is included with the OFL package to accelerate configuration.
Note: Platform-specific videos for MotiveWave, NinjaTrader, and EdgeProX are provided in the Discord.
Example use case
The market opens at the top of the overnight range, pushes through the overnight high, and then rotates back below it. That early failure hints at exhaustion. With MGI structure and an LVN above as confluence, a short entry targets the JOB Pivot. Price reaches the pivot but cannot follow through to the downside. Holding above the pivot flips the read: the failed continuation becomes the entry trigger for a long back into the upper target zone.