What is JOB Pivots Weekly?
JOB Pivots Weekly is a study that generates a higher-timeframe pivot from the previous week's activity. It functions like the daily JOB Pivot but covers the entire week, highlighting key zones to watch and trade against. The output is a weekly pivot area plus surrounding targets that act as references for both swing planning and intraday context.
Who it's for
- Swing and position futures traders who plan trades a week at a time
- Day traders who want higher-timeframe context layered on intraday charts
- ES, NQ, and CL traders who anchor weekly bias to auction structure rather than calendar pivots
- Auction Market Theory traders mapping current week progress against the prior week
- OFL package users pairing weekly pivots with daily MGI and execution studies
How JOB Pivots Weekly works
Weekly pivot zone
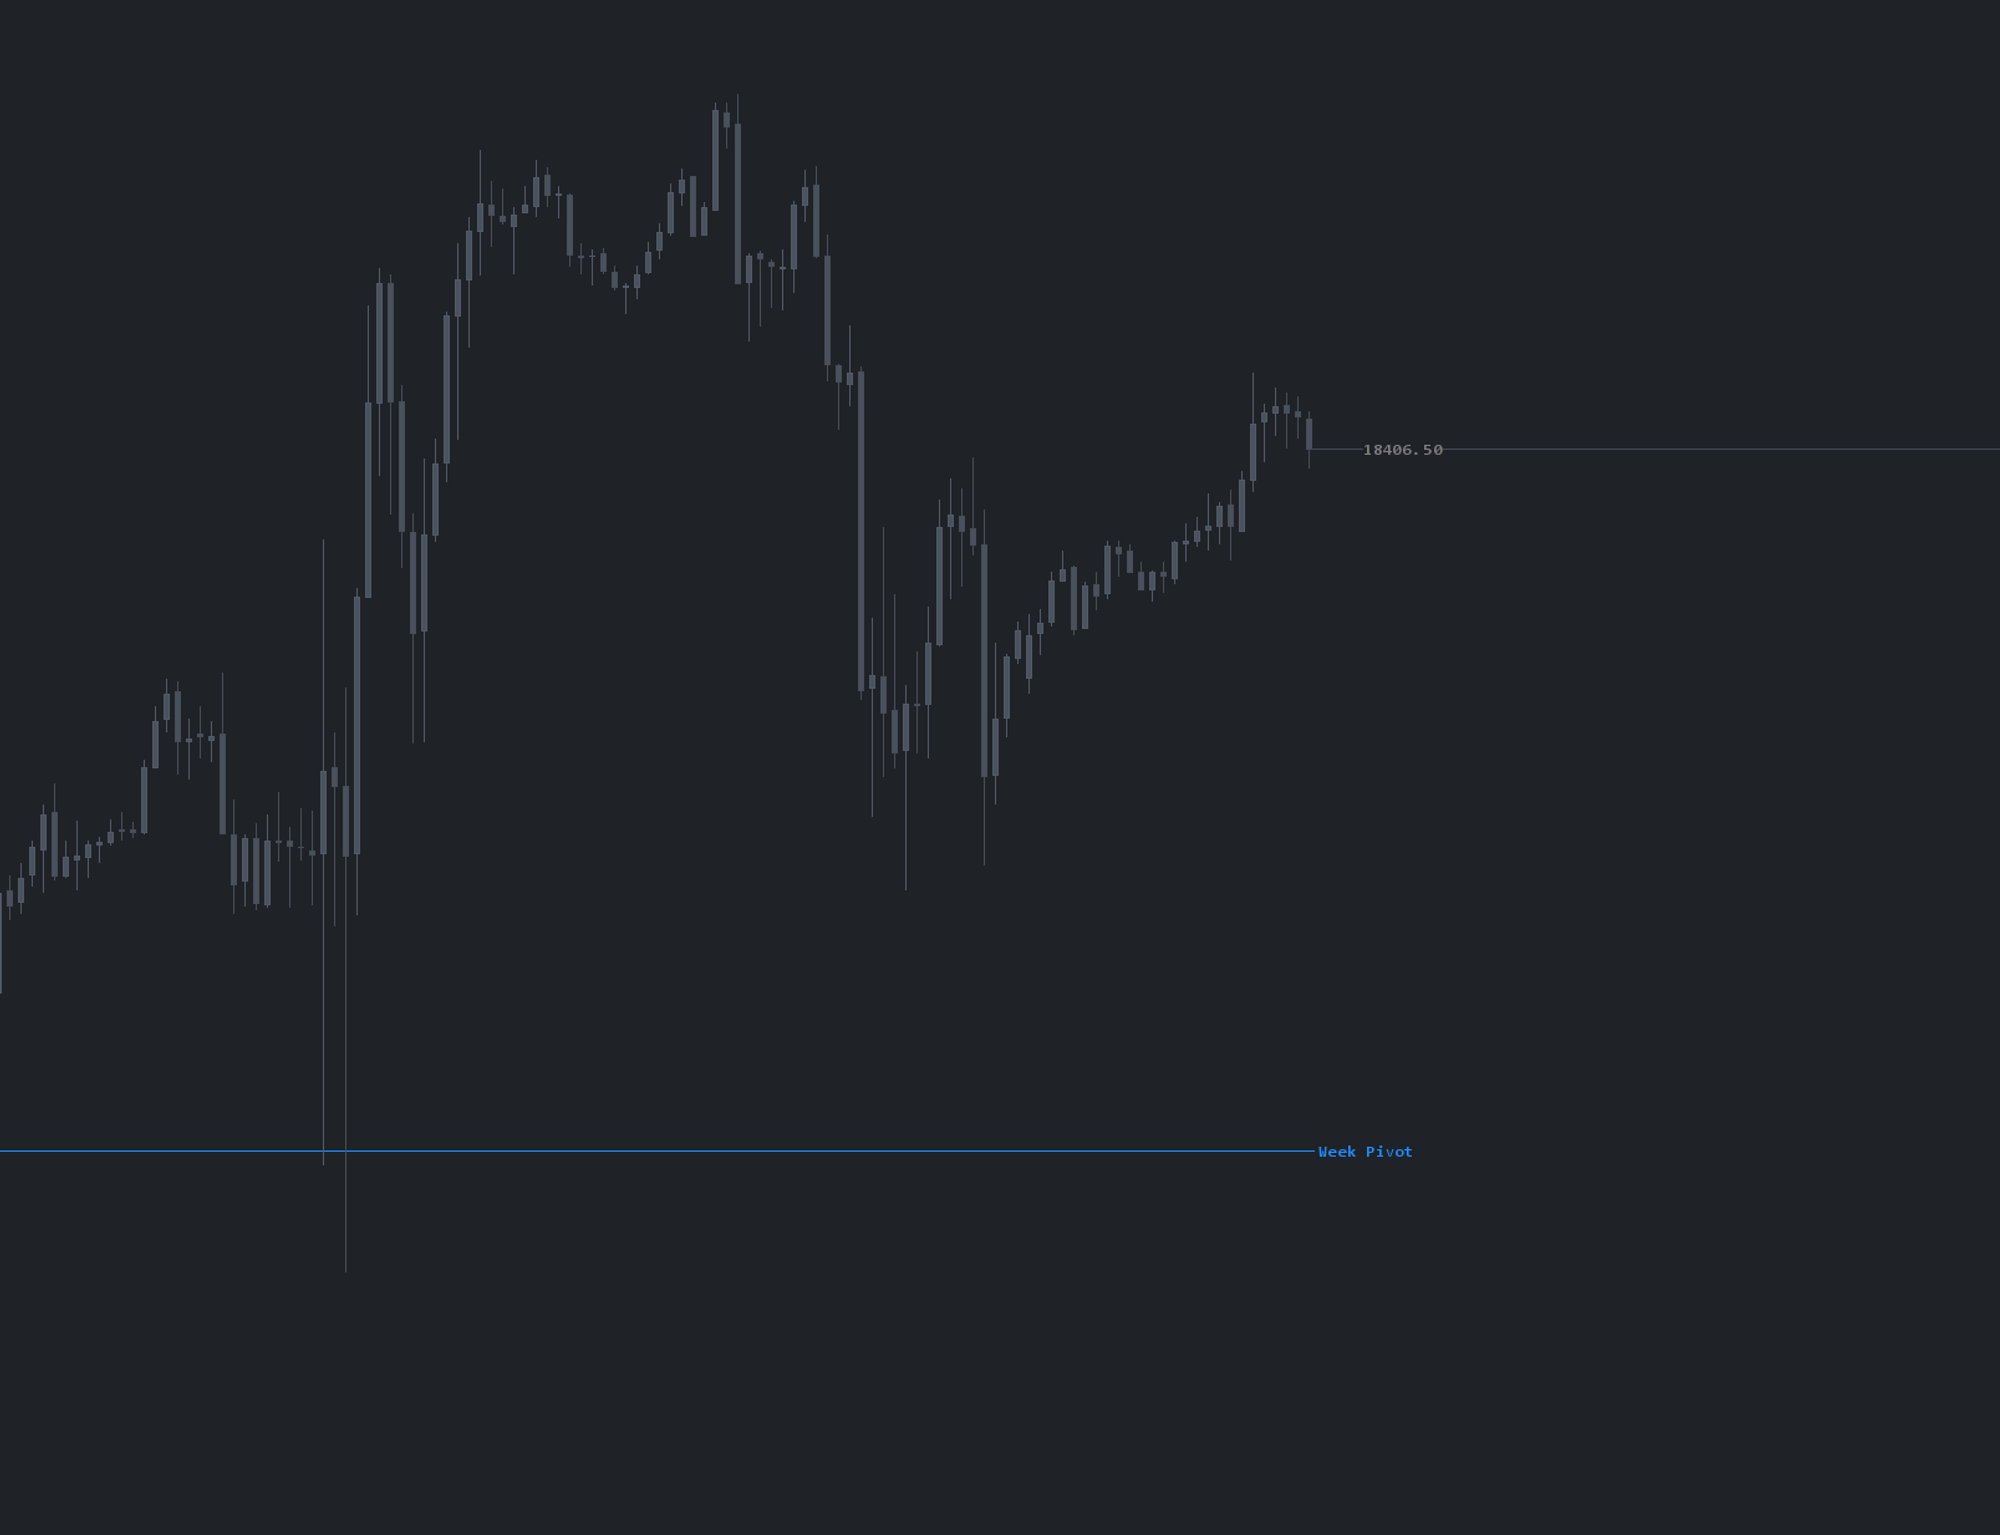
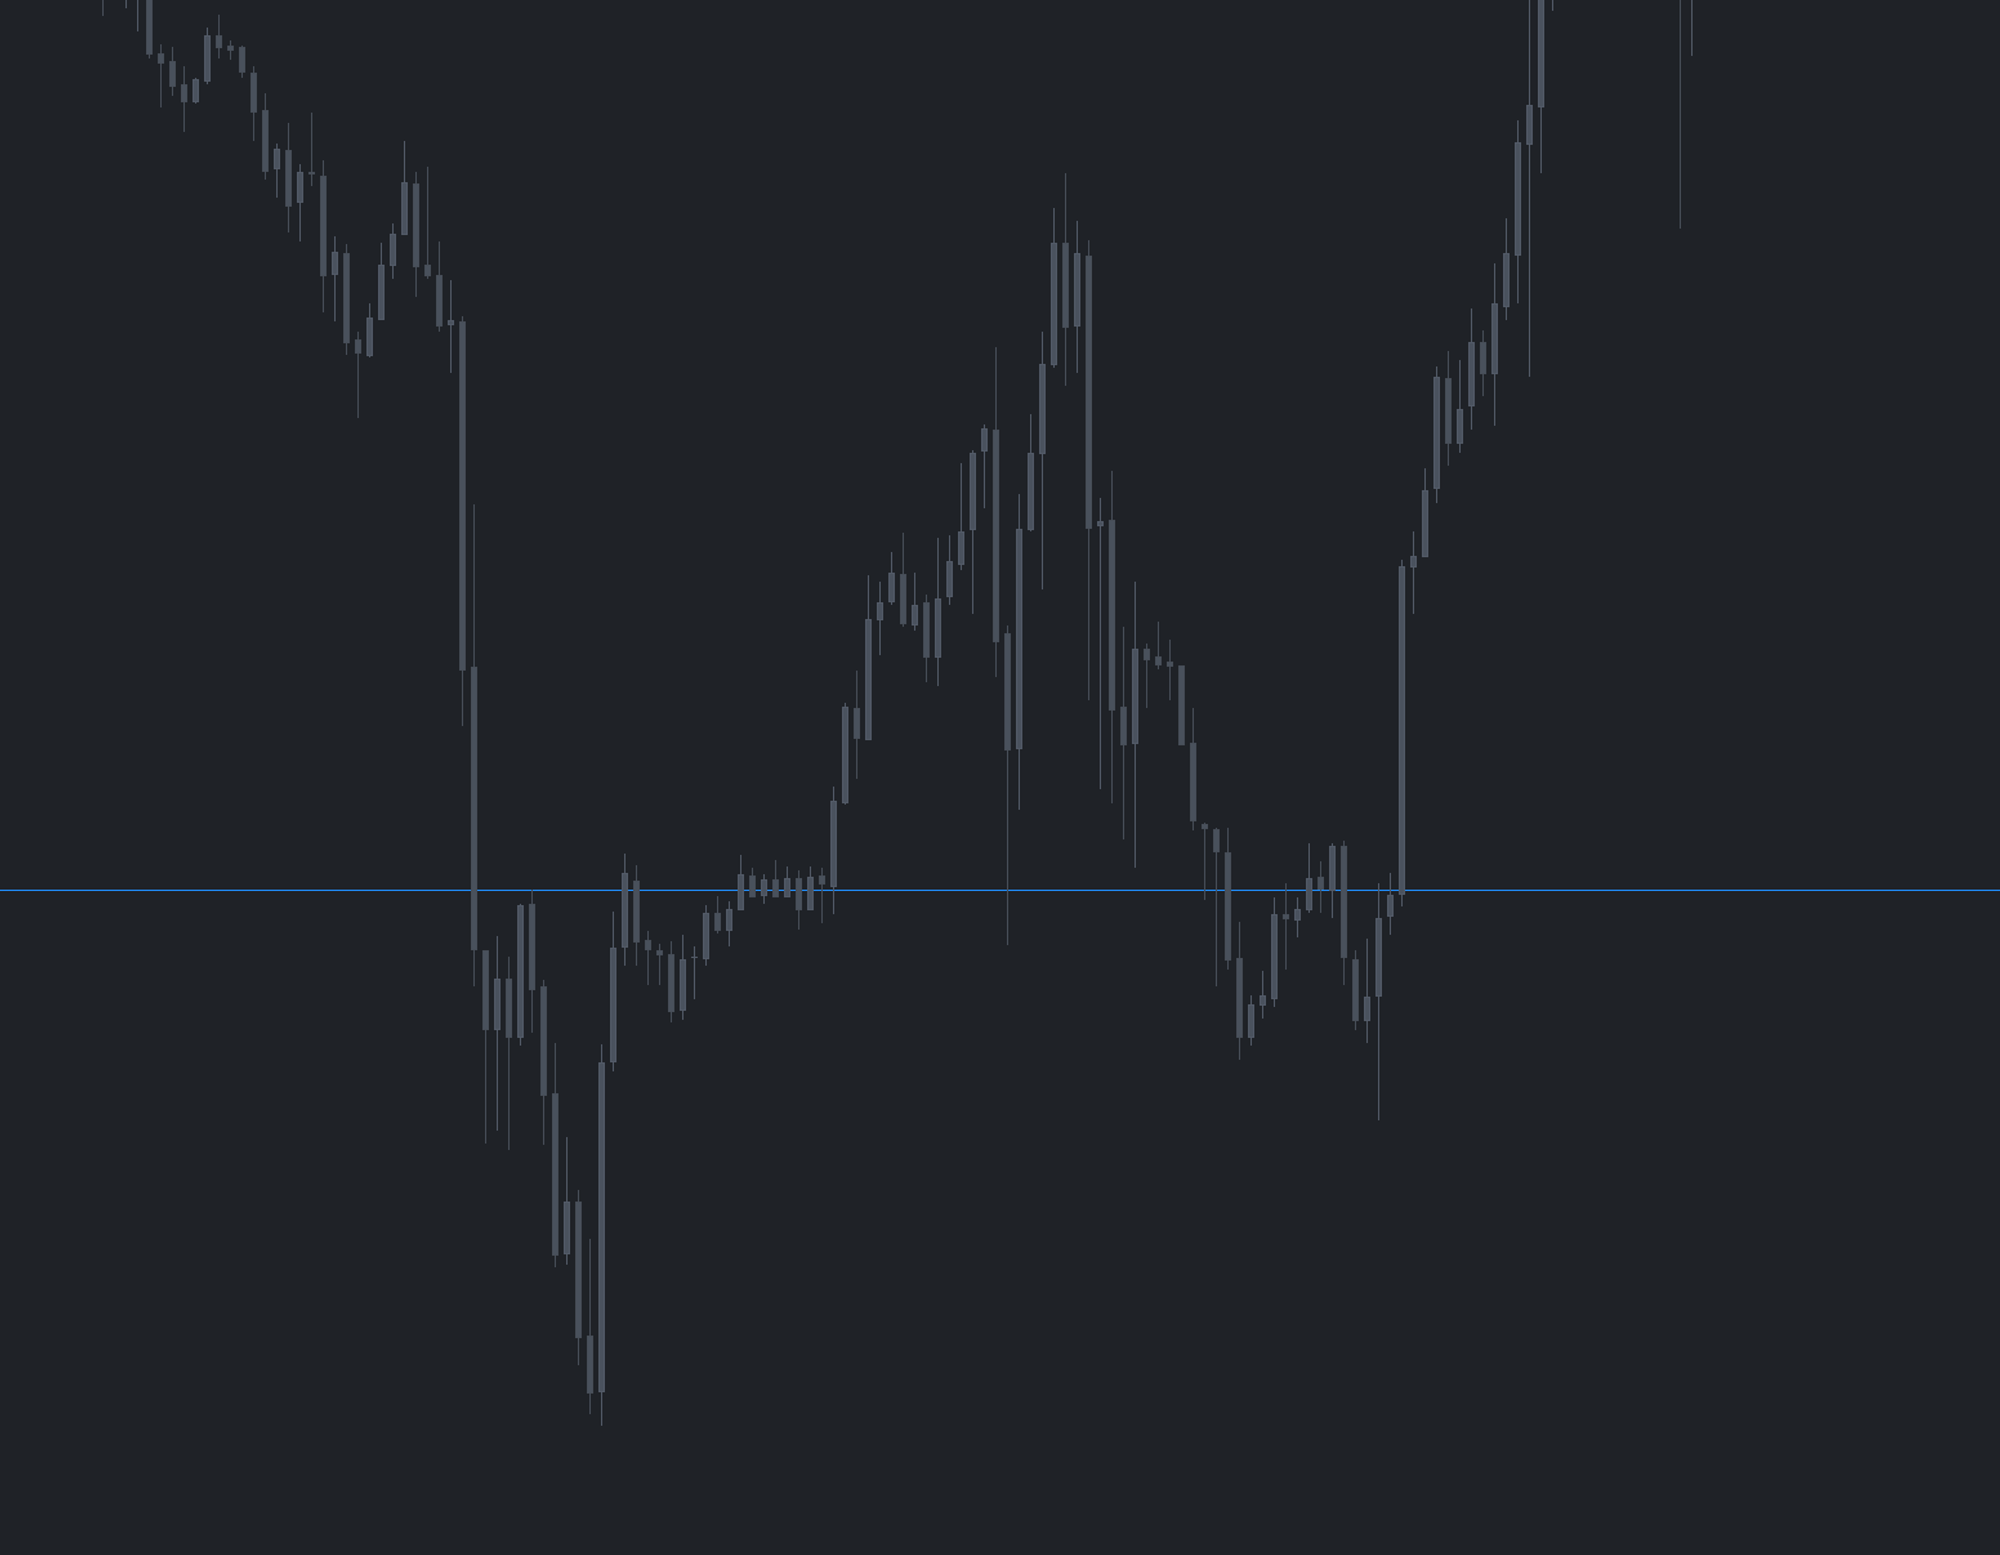
The study draws a weekly pivot area from the prior week's auction. Unlike a single-line daily pivot, the weekly version is best read as a zone: an area the market either accepts or rejects across multi-day sessions. Surrounding target areas project where the weekly auction may stall, rotate, or extend.
Mapping current week vs. prior week
The primary value is contextual. If the bulk of the current week's volume and interest is building below the weekly pivot, that is a structural read on weekly weakness. If interest builds above the pivot and the auction holds, that is weekly strength. Use the pivot to map where price is in the weekly auction before committing capital.
Combining with execution tools
Weekly pivot reactions tend to play out across multiple sessions, so entries should still be timed with OFL execution tools — DOM, time and sales, absorption, exhaustion — rather than blindly fading or buying the level. The pivot and target areas are zones of interest, not tick-precise lines.
Setup & installation
- Install the JOB Pivots Weekly study from the OFL package in a supported platform of your choice (Sierra Chart, MotiveWave, NinjaTrader, or EdgeProX).
- Apply it to your primary symbol chart and confirm enough historical sessions are loaded.
- Verify the weekly pivot zone and target areas plot for the current week.
- Layer it under your daily JOB Pivots and MGI studies for full context.
Watch the JOB Pivots Weekly Sierra Chart setup guide. A chartbook is included with the OFL package.
Note: Platform-specific videos for MotiveWave, NinjaTrader, and EdgeProX are provided in the Discord.
Example use case
In Monday morning planning, you notice the bulk of last week's volume and current week's developing interest is forming below the weekly pivot zone. That contextual read flags potential weakness. Mid-week, price rallies up into the weekly pivot from below. Treating that area as resistance, you watch for an exhaustive push or absorption at or near the pivot using OFL execution tools, then position short toward the lower target area on confirmation.