What is MGI Weekly?
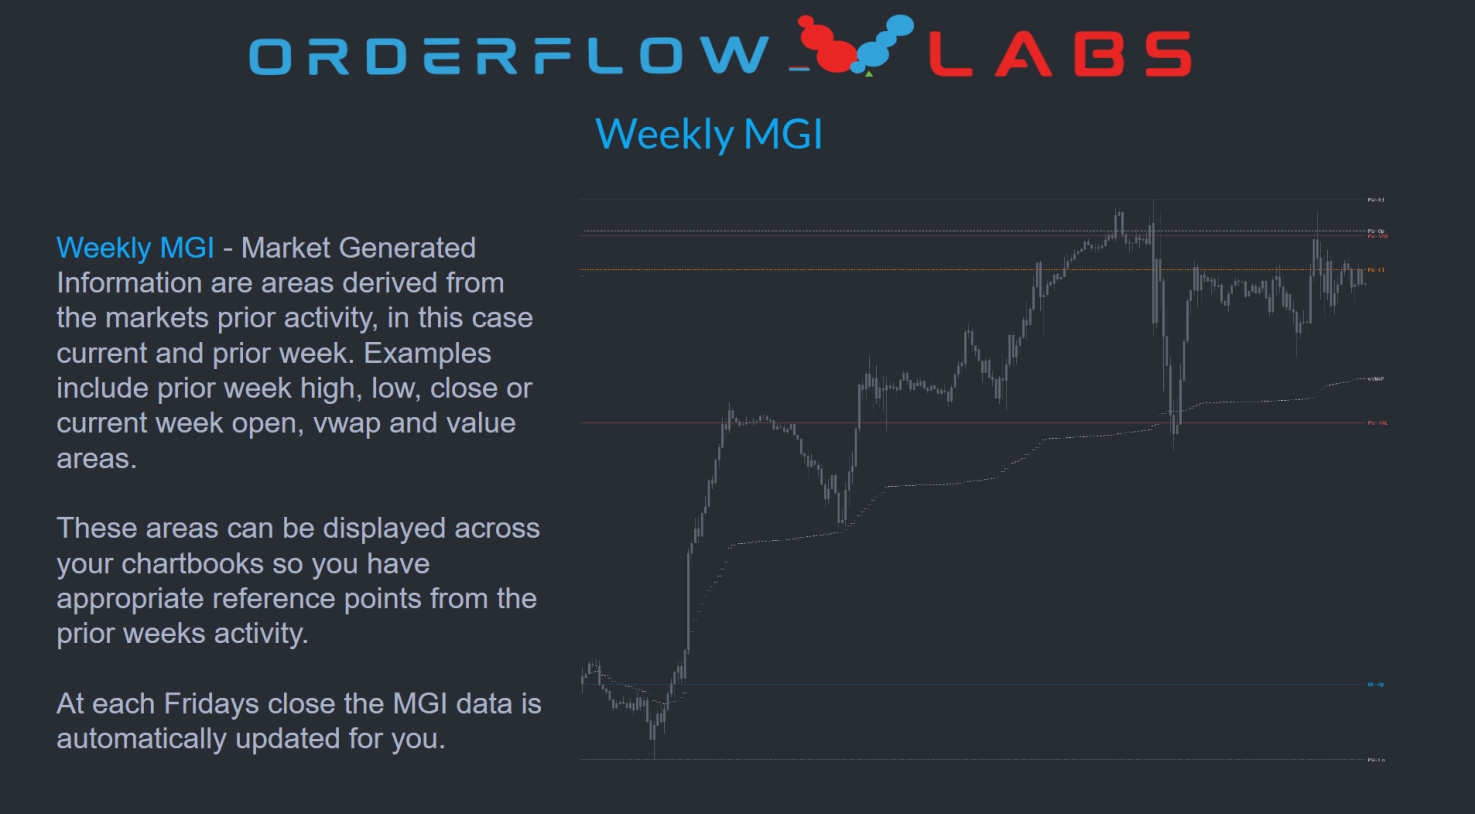
MGI Weekly is a study that renders the weekly layer of Market Generated Information. It bridges the daily and monthly maps with weekly-specific levels: Weekly IB and extensions, Weekly VWAP, prior-week and current-week value area structure, and key weekly anchors. Use it as a standalone weekly framework or layered with MGI Daily for full multi-timeframe context.
Who it's for
- Swing and position futures traders building weekly plans
- Day traders who want weekly structure under their intraday levels
- Auction Market Theory traders mapping weekly value area development
- Initial Balance strategy traders extending the IB concept to the weekly timeframe
- OFL package users pairing weekly MGI with JOB Pivots Weekly
How MGI Weekly works
Weekly levels rendered
MGI Weekly plots a focused set of weekly references. Full glossary below.
| Level | Description | Group |
|---|---|---|
| Weekly IB | Weekly Initial Balance — starts at Sunday Globex open, ends 30 hours later | Weekly IB |
| Weekly IB Extensions | 50% / 100% / 150% / 200% extensions of the Weekly IB | Weekly IB |
| Weekly VWAP | Volume-weighted average price across the entire week | Weekly VWAP |
| Prior Week High | Highest traded price of the prior week | Prior week |
| Prior Week Low | Lowest traded price of the prior week | Prior week |
| Prior Week Close | Closing price of the prior week | Prior week |
| Prior Week Open | Opening price of the prior week | Prior week |
| Prior Week VAH | Prior week's Value Area High | Prior week |
| Prior Week VAL | Prior week's Value Area Low | Prior week |
| Prior Week POC | Prior week's Volume Point of Control | Prior week |
| Current Week Open | Sunday Globex open of the current week | Current week |
| Current Week VAH | Developing Value Area High for the current week | Current week |
| Current Week VAL | Developing Value Area Low for the current week | Current week |
| Current Week Mid | Halfback between current-week High and Low | Current week |
Reading the weekly map
Use Weekly IB extensions to gauge how aggressively the week is initiating. Use prior-week value area edges and POC as zones for acceptance, rejection, or rotation. Current-week value area and mid show where the auction is building this week relative to last. Weekly VWAP is the volume-weighted reference that institutional flow trades around.
Confluence with daily and monthly
Weekly levels are most powerful when daily MGI references stack with them — for example, prior-day high coinciding with prior-week VAH, or today's RTH open landing on Weekly VWAP. Layer MGI Weekly with MGI Daily and MGI Monthly to see those alignments instantly.
Setup & installation
- Install MGI Weekly from the OFL package in a supported platform of your choice (Sierra Chart, MotiveWave, NinjaTrader, or EdgeProX).
- Set the chart to a 24-hour session timeframe.
- Set the bar period to 1, 5, 15, or 30 minutes (30-minute is the recommended default).
- Apply the study, configure Weekly IB extension percentages, and confirm levels plot.
- Layer alongside MGI Daily and JOB Pivots Weekly for a full weekly framework.
Watch the MGI Weekly Sierra Chart installation guide. A chartbook is included with the OFL package.
Note: Platform-specific videos for MotiveWave, NinjaTrader, and EdgeProX are provided in the Discord.
Example use case
Sunday evening you load the chart and see price opening above the Weekly VWAP and inside the prior-week value area. By Tuesday, the market has driven through the Weekly IB high and tagged the 100% Weekly IB extension. That extension level lines up with prior-week VAH, creating a confluence zone. You flag it as a potential weekly target, watch for exhaustion or absorption with OFL execution tools, and either book longs or set up a counter-rotation back toward Weekly VWAP.