What is Buy/Sell Zones?
Buy/Sell Zones is an automated retracement study that highlights areas where a futures market is statistically likely to pull back after a directional rotation. The study tracks each rotation high and low and projects high-probability re-entry zones in real time. On a retest, the risk-to-reward profile is favorable because the aggressive side has already shown willingness to initiate from the area.
Who it's for
- Futures traders who plan around pullbacks rather than chasing breakouts.
- ES, NQ, CL, and GC day traders.
- Order-flow traders who pair structural levels with DOM and Time and Sales execution.
- Discretionary traders who want consistent, rules-based zones instead of hand-drawn retracements.
- Traders building a workflow on top of the OFL package.
How Buy/Sell Zones works
Rotation tracking
The study continuously tracks rotation highs and rotation lows as price action unfolds. Each completed rotation becomes a candidate for a Buy or Sell Zone projection.
Automated retracement mapping
Once a rotation is recorded, the study maps a retracement area based on the configured parameters. These zones appear directly on the chart so you can see, at a glance, where the next high-probability pullback opportunity sits.
Configurable or recommended settings
Buy/Sell Zones offers full flexibility on rotation thresholds and retracement depth. You can run the OFL Recommended settings out of the box or tune the study to your instrument and timeframe.
Designed to pair with execution tools
Buy/Sell Zones tells you where; it does not tell you when. Once price is inside a zone, the trader's job is to evaluate the response using the Depth of Market, Time and Sales, and the OFL execution tools.
Setup and installation
The recommended chart configuration is a 24-hour session chart with one-minute bars for intraday work. The study is then dropped onto the chart and configured with either custom parameters or the OFL Recommended defaults.
Watch the Buy/Sell Zones Sierra Chart installation guide for chart settings, study placement, default parameters, and rotation tuning. A chartbook is included with the OFL package to mirror the recommended configuration.
Note: Platform-specific videos for MotiveWave, NinjaTrader, and EdgeProX are provided in the Discord.
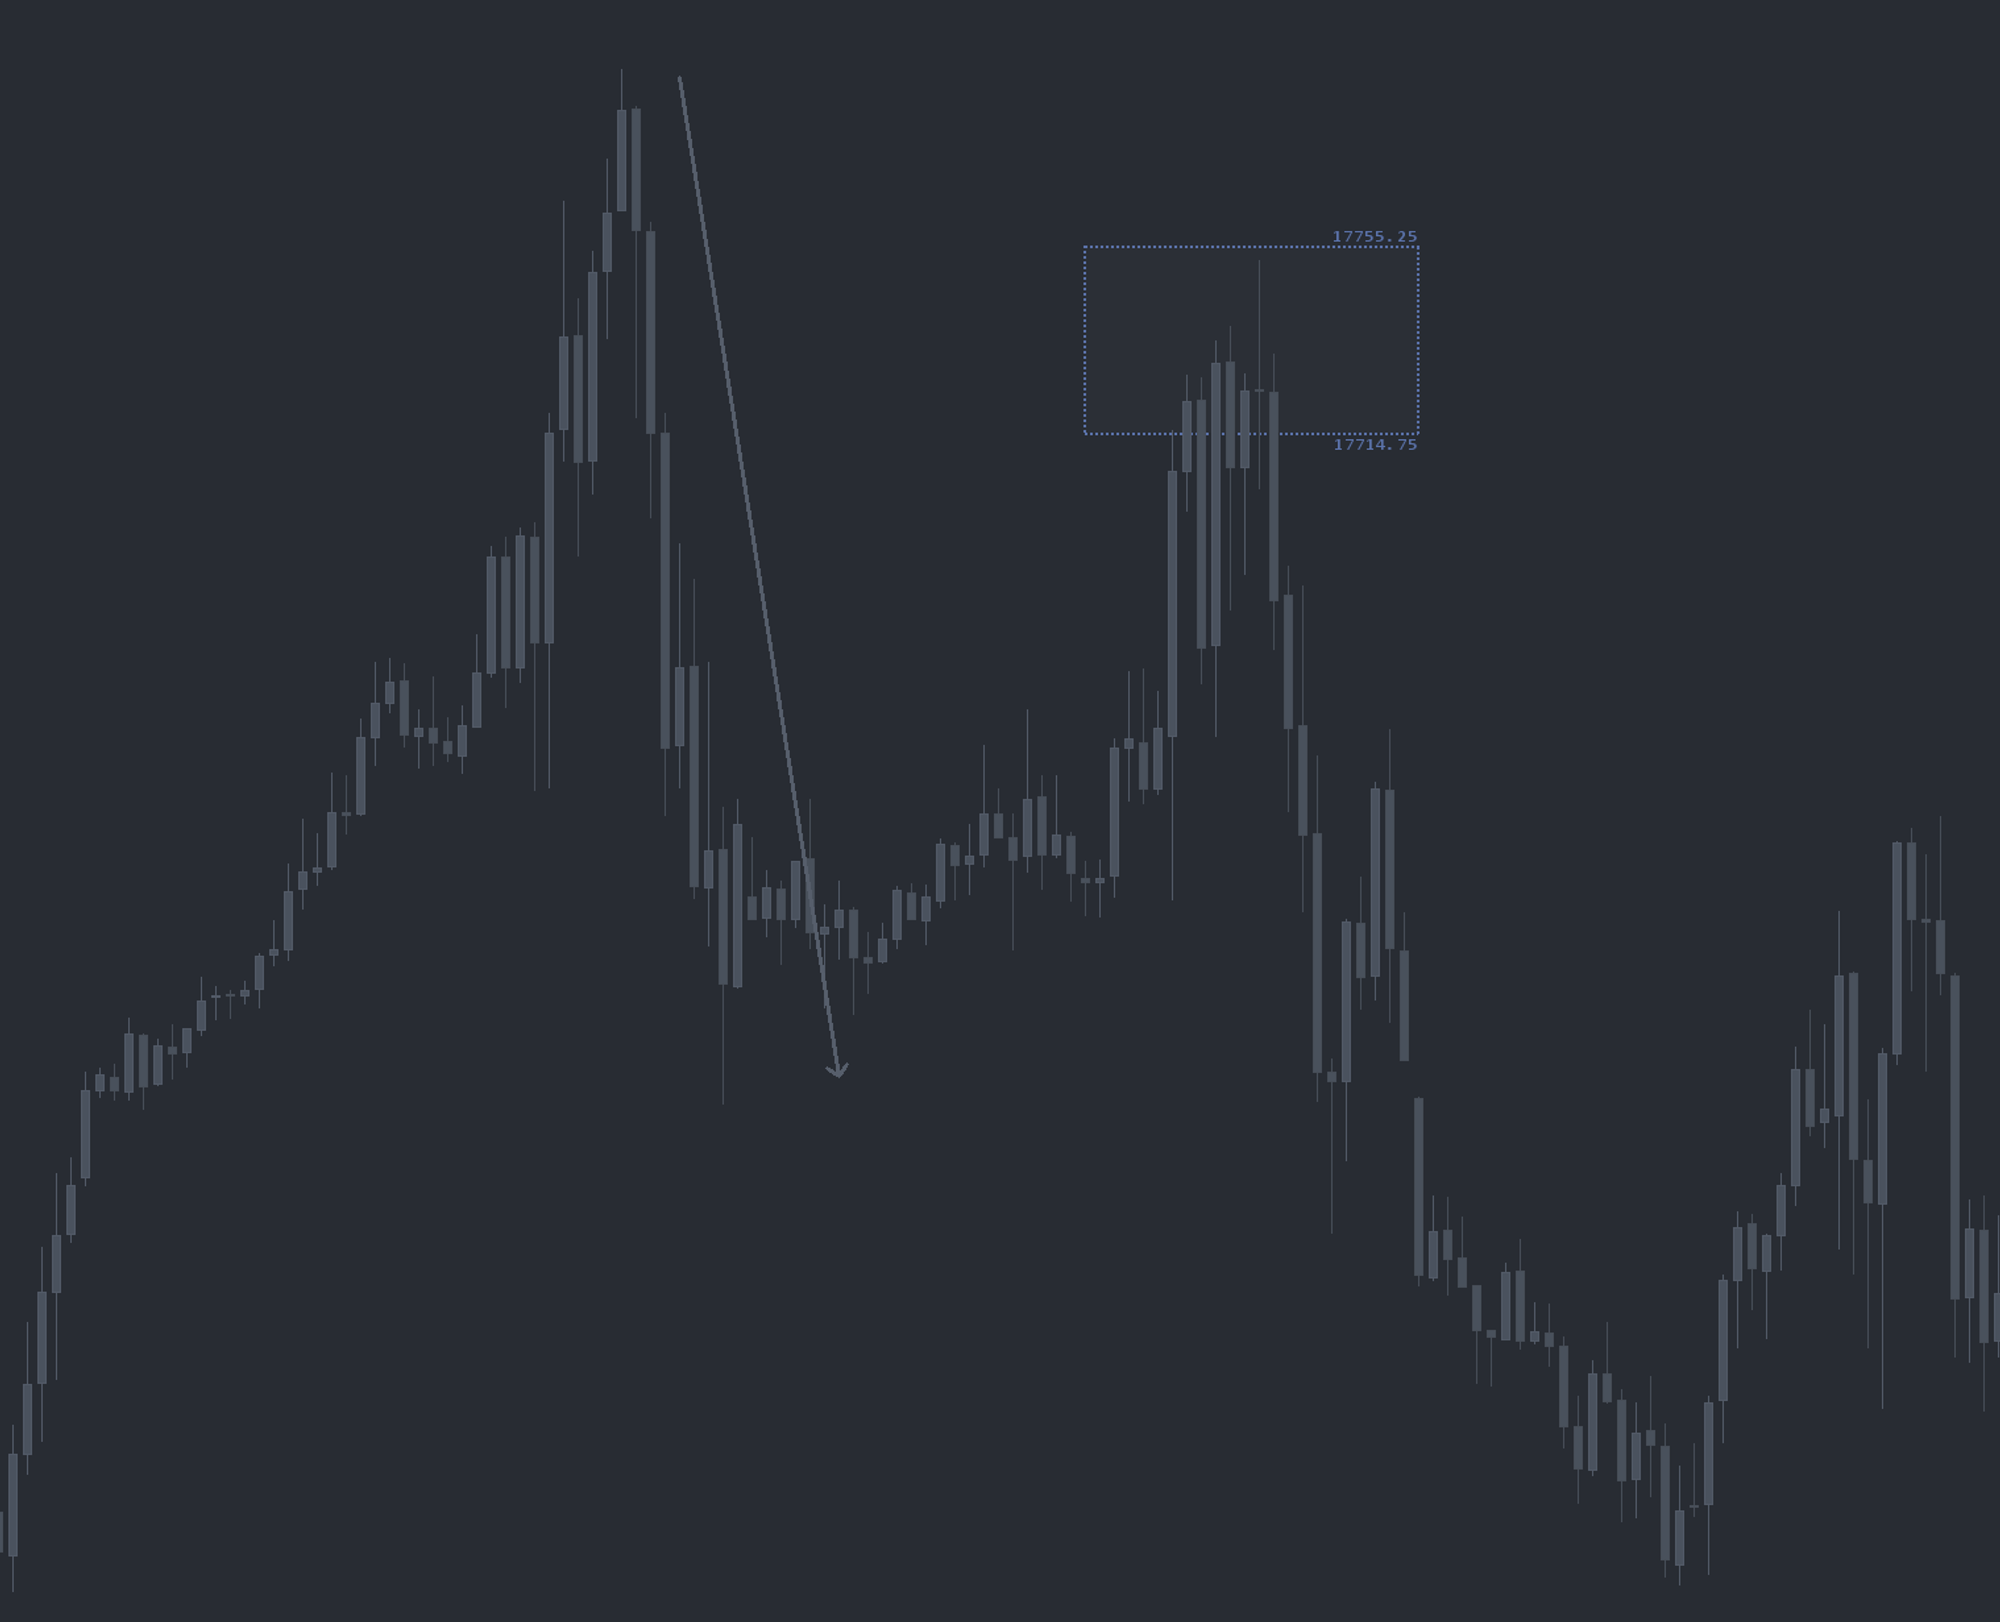
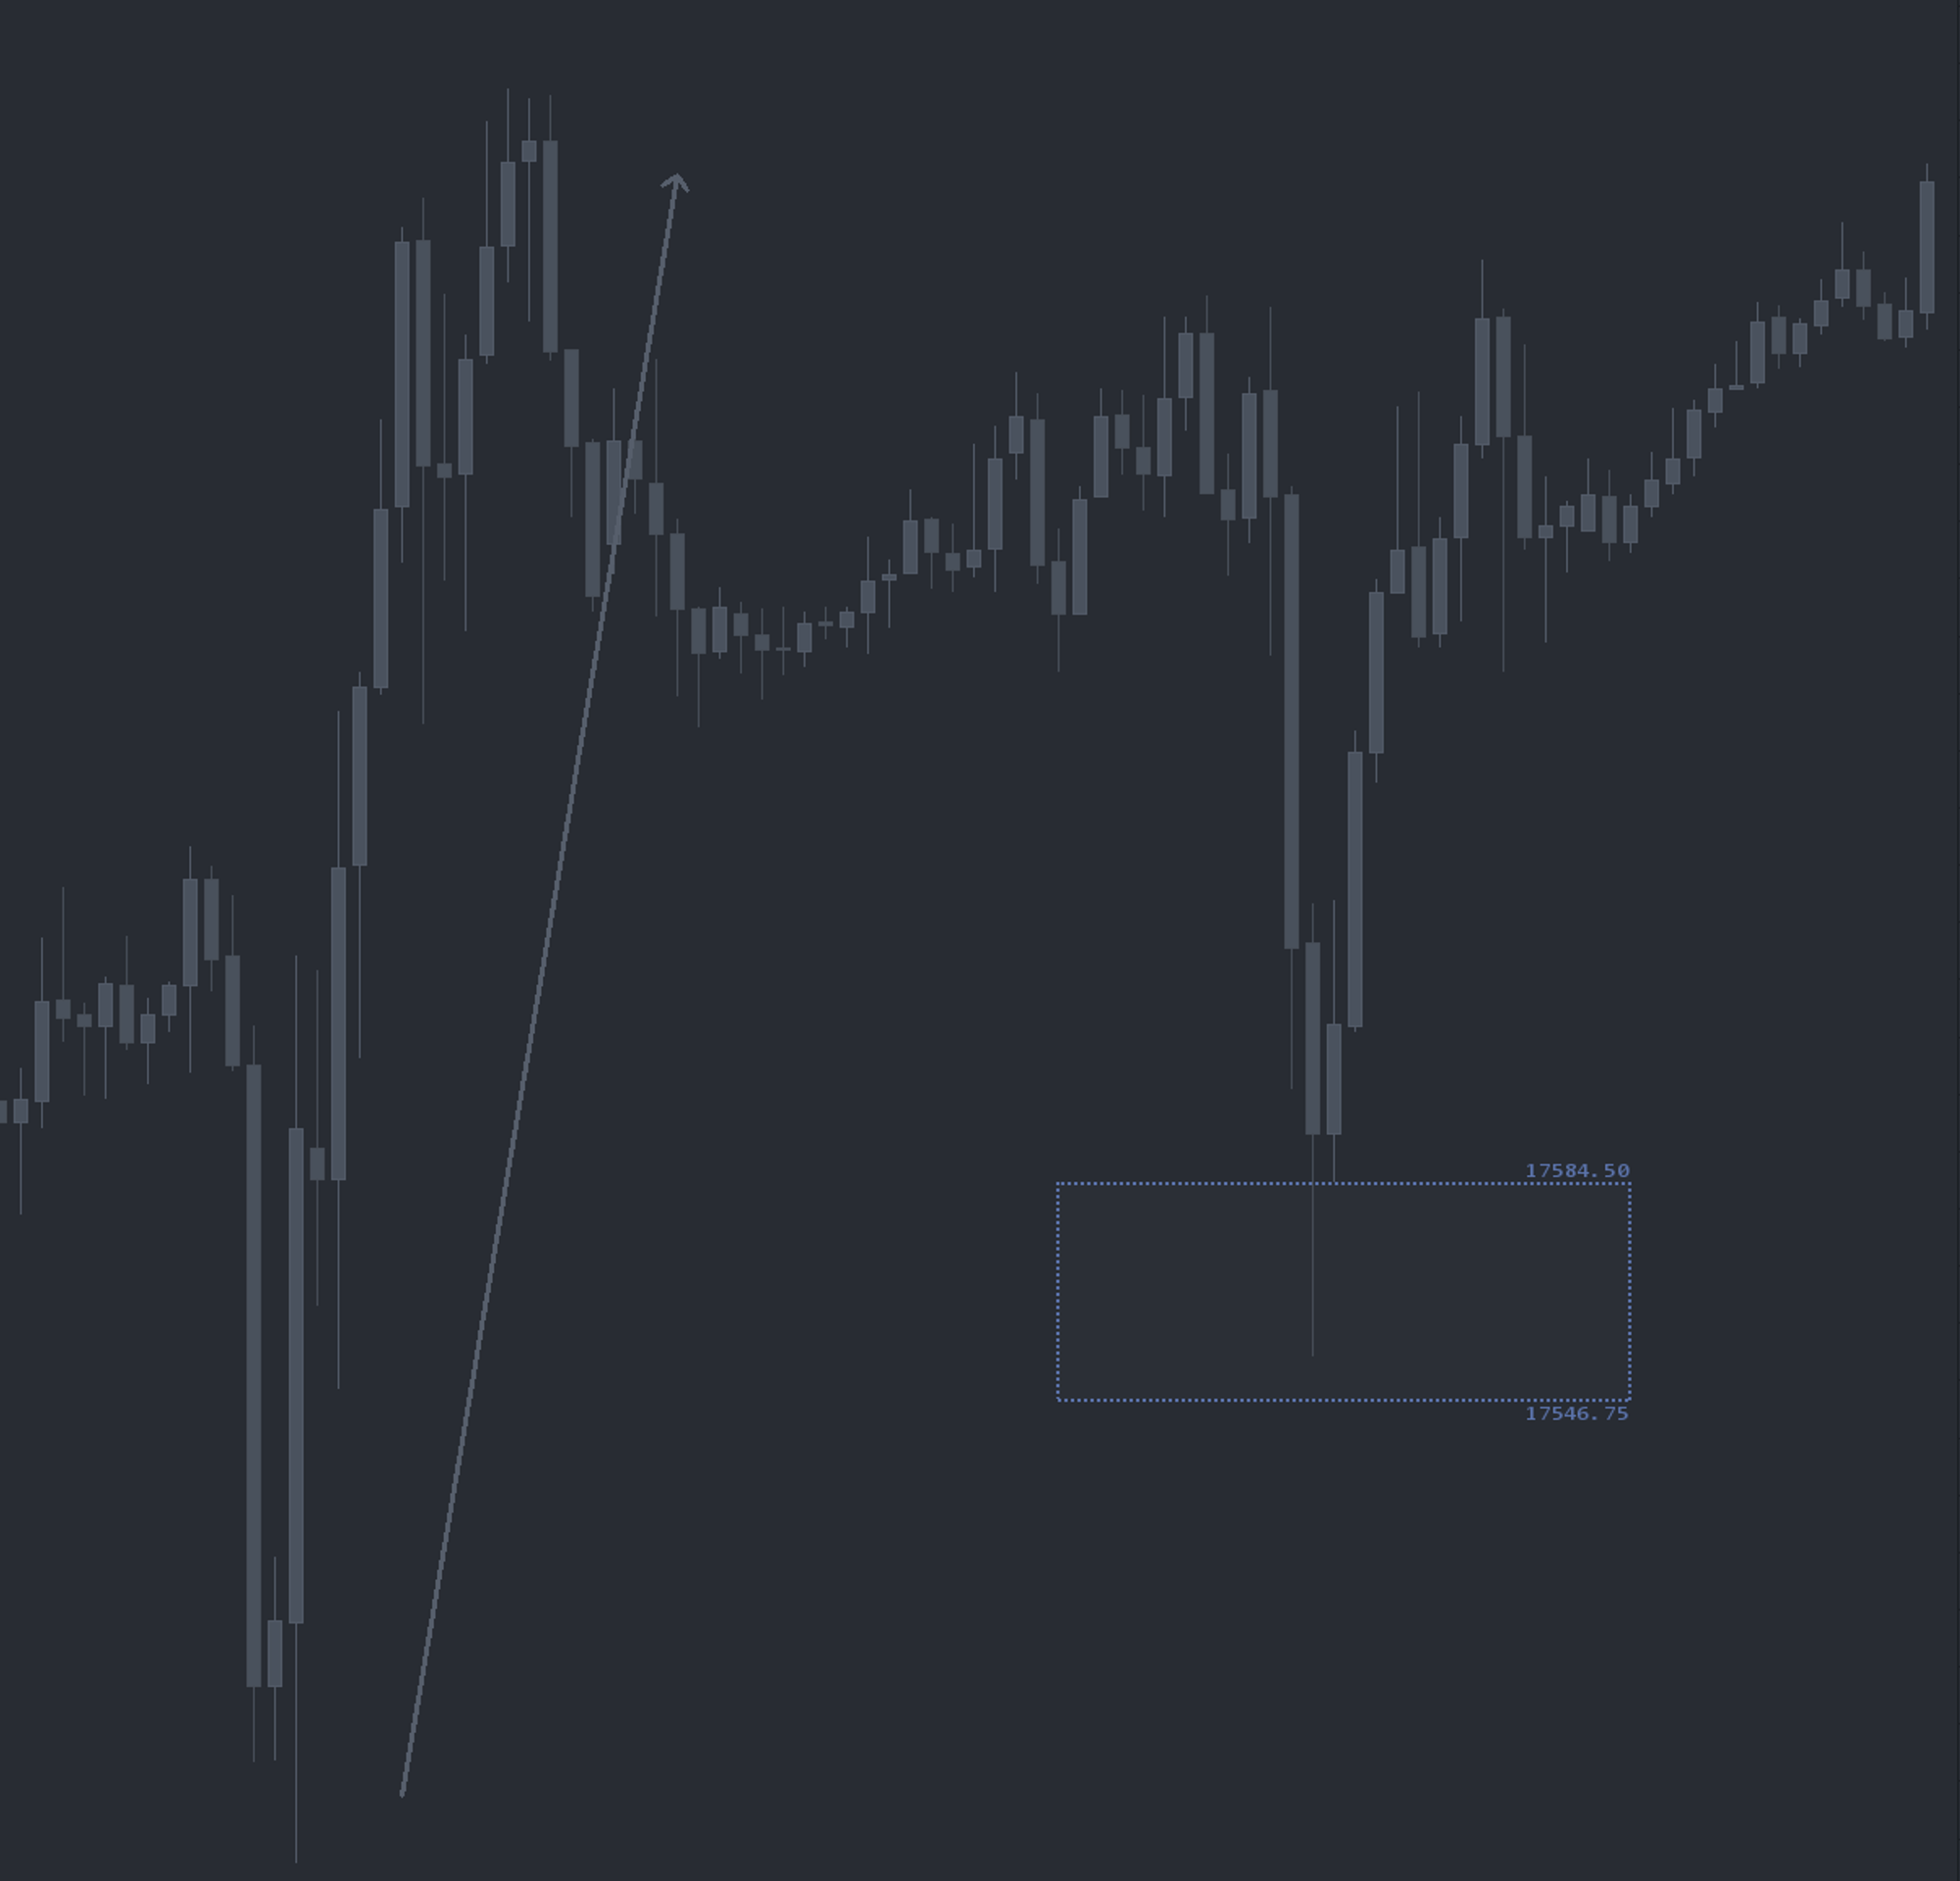
Example use case
The market aggressively pushes to a new session high, stalls, and pulls back. Buy/Sell Zones automatically draws a Buy Zone on the rebid area created during that rotation. Rather than chasing the initial run, you wait for price to retrace into the zone, then evaluate whether buyers are re-engaging through the DOM, Time and Sales, or an OFL execution tool. The mirror image holds for sell-side trades: instead of trying to short the run higher, you wait for the counter move and the retest of the Sell Zone, then look for sellers to re-offer.