What is EAD?
EAD is an execution-grade order flow study that evaluates the pace and aggressiveness of every trade hitting the book, with a focus on the dominant side's willingness to cross the spread. When that aggression dries up, or when the opposite side starts proactively replenishing the book, EAD prints a triangle pointing in the direction of the likely turn — flagging a rotation that has probably peaked.
Who it's for
- Reversal and fade traders working extremes like overnight high/low, prior day high/low, and IB extremes.
- Order flow traders looking for absorption confirmation at LVNs, VWAP, and session pivots.
- Discretionary futures traders on ES, NQ, CL, and other CME products.
- Scalpers fading exhausted moves on tick or volume bar charts.
- Existing OFL users adding an exhaustion filter alongside Dominator and Liquidity Zones.
How EAD works
Two ways a rotation ends
EAD watches for two specific conditions on the dominant side of a rotation. Using aggressive buyers as an example:
- The buyers stop crossing the offer and decrease their aggression.
- The sellers become more proactive in replenishing the offer faster than buyers can lift it.
When either condition is met, a sell-side triangle prints, indicating the buy rotation has likely peaked. The reverse logic prints buy-side triangles after a sell rotation runs out.
Triangles, not arrows
EAD plots triangles in real time at the price where exhaustion or absorption was detected. Triangles are non-repainting and pair cleanly on the same chart as Dominator arrows for layered execution reads.
Confluence-first execution
EAD is not a standalone trade signal. Like every OFL execution study, it is engineered to confirm or invalidate a thesis at a key structural level — LVNs, Session Value Pivots, Target Lines, VWAP, Weekly Open, prior day OHLC, OFL Buy and Sell Zones, and other local structure.
Setup and installation
- Install the OFL package in a supported platform of your choice (Sierra Chart, MotiveWave, NinjaTrader, or EdgeProX).
- Apply the EAD study to your execution chart on the instrument you trade most actively.
- Load the recommended EAD settings (defaults are calibrated for liquid CME futures).
- Layer EAD on top of your structural chart so triangles are interpreted in context.
Watch the Sierra Chart setup guide: EAD Installation (Sierra Chart). The chartbook and configuration files are included with the OFL package.
Note: Platform-specific videos for MotiveWave, NinjaTrader, and EdgeProX are provided in the Discord.
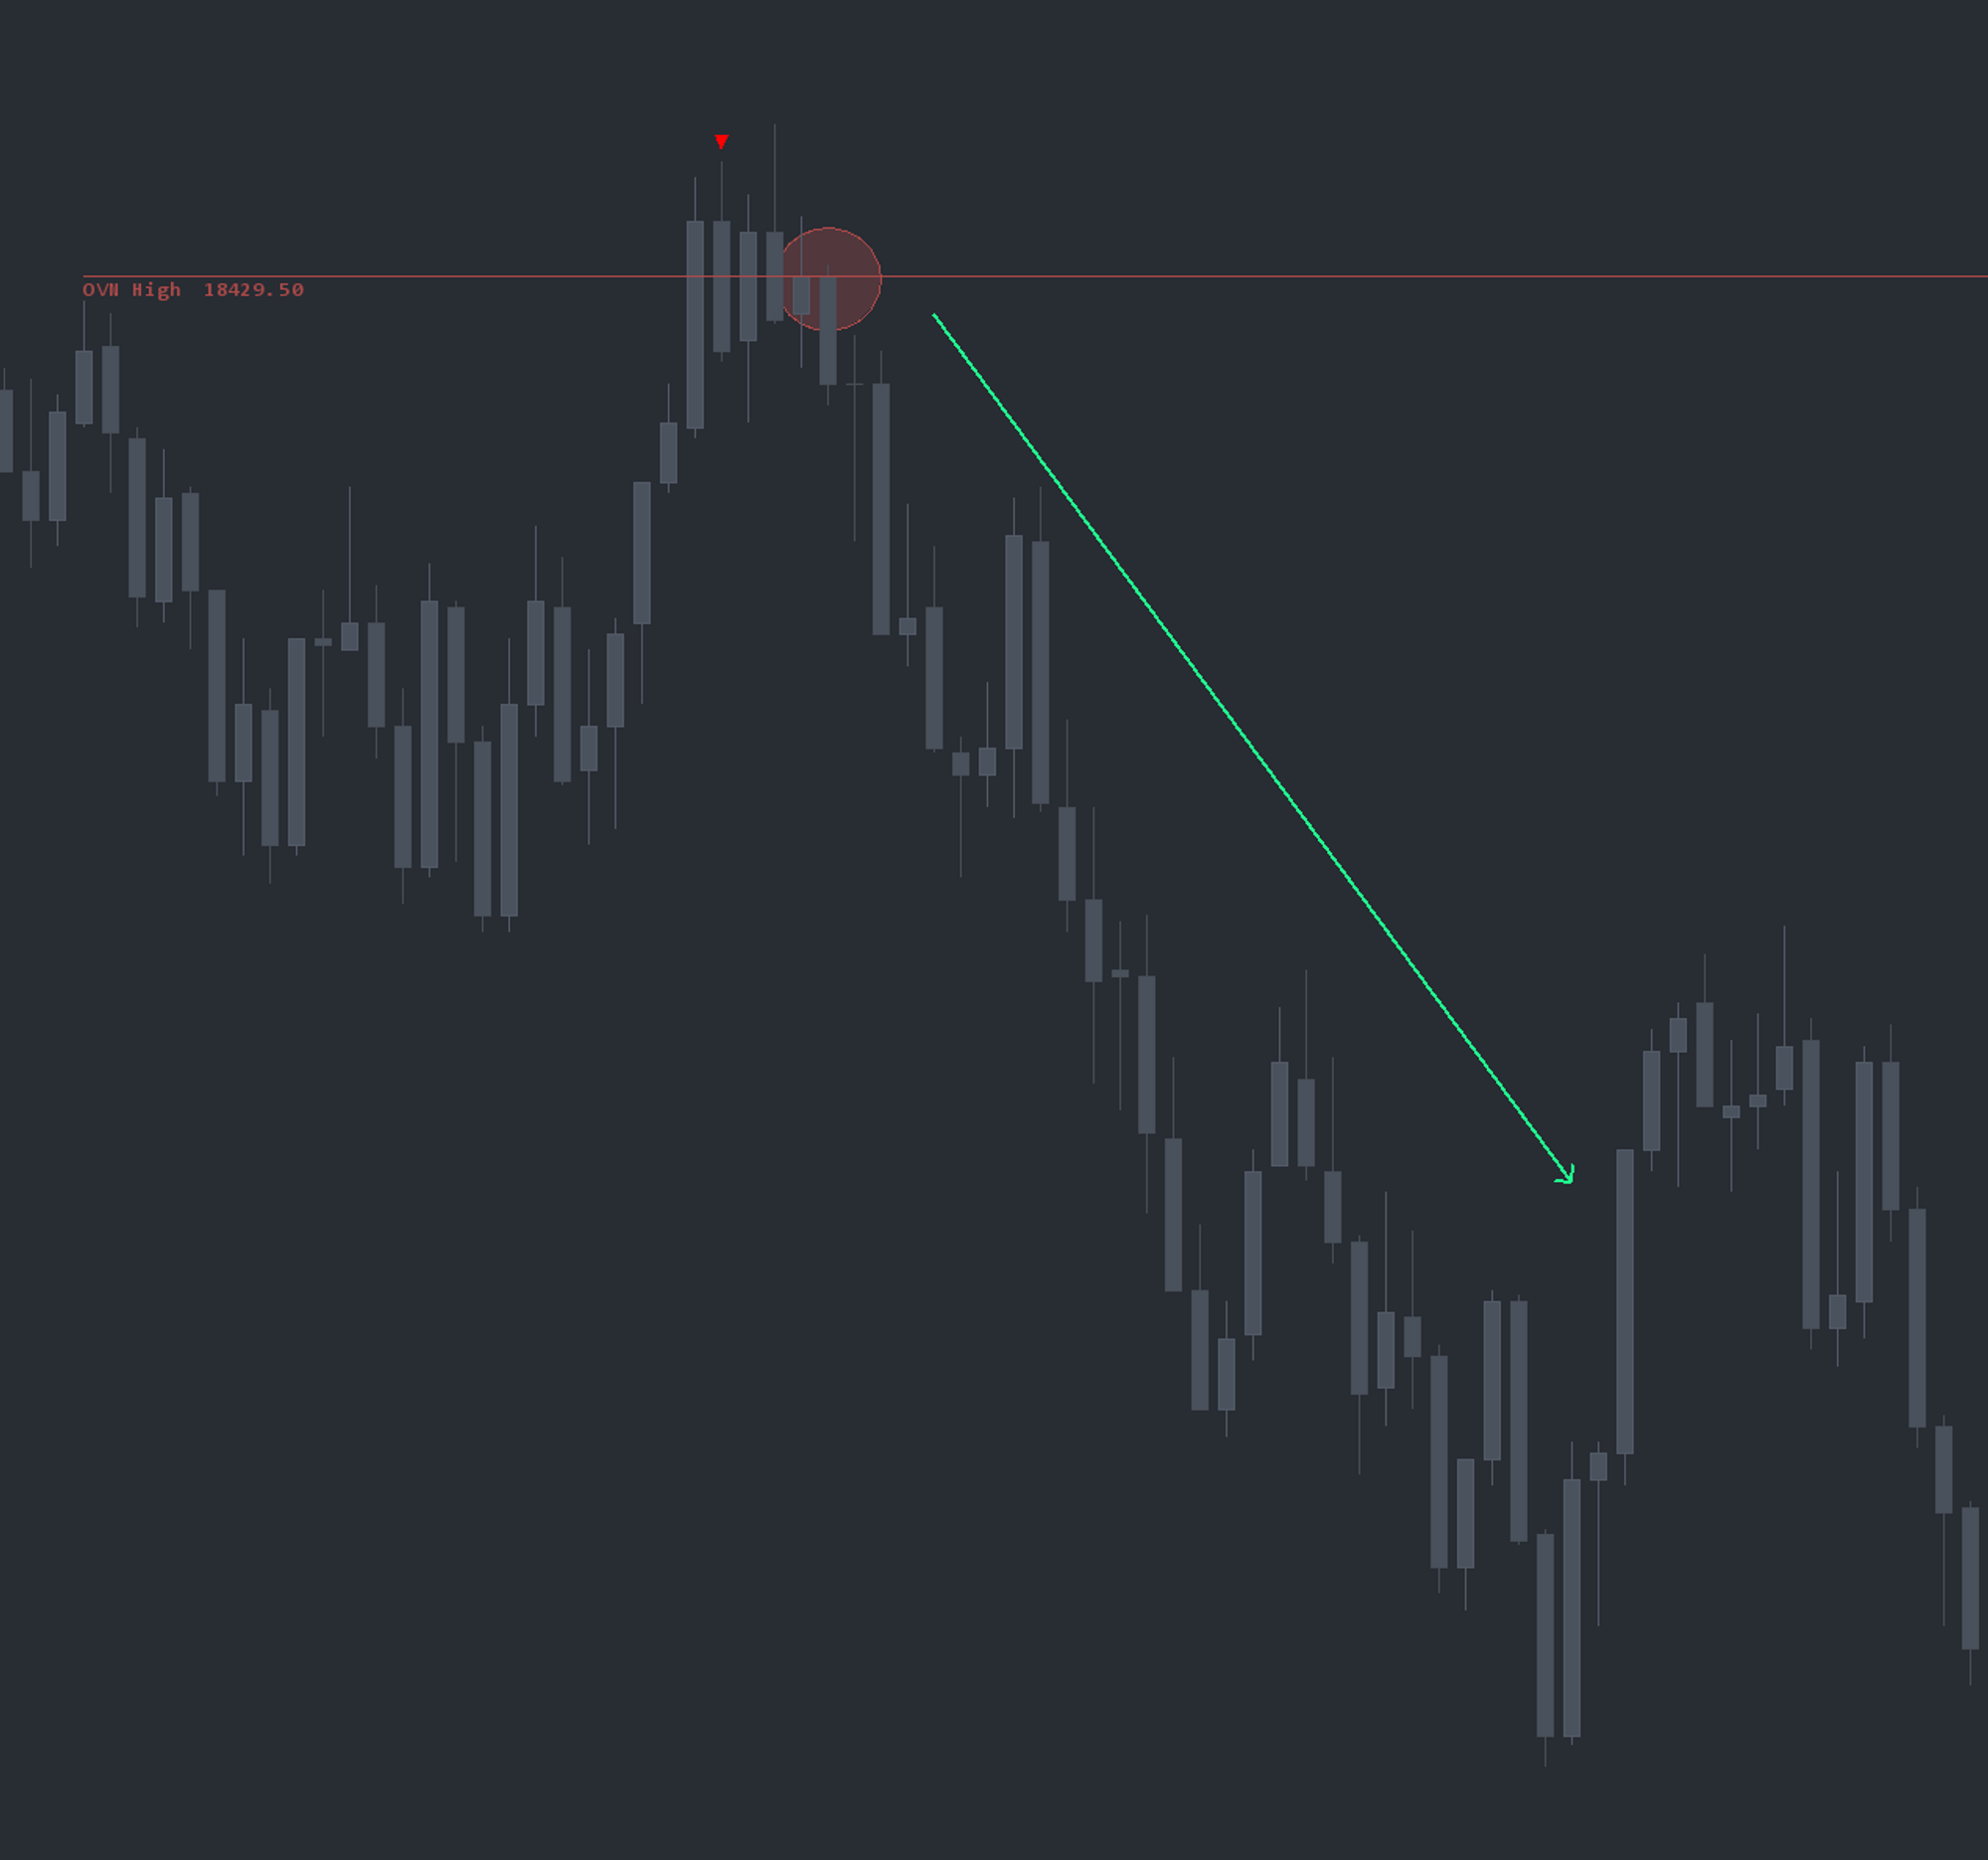
Example use case
Assume an Overnight High at 18,429.50 on NQ. Price opens at 18,415, rotates up to 18,435, and breaks the overnight high. As the rotation peaks, a sell-side EAD triangle prints — a potential trap above the extreme. Rather than fading immediately, a trader waits for confirmation: price rolls back below the overnight high and back-tests it as resistance. The short is initiated on the back-test with EAD confluence, targeting a move back into the overnight range.