What is Leg 2 Leg Profiles?
Leg 2 Leg Profiles is an automated rotational volume profile study. It anchors a volume profile to the most recent swing high or low and continues drawing until a new rotation completes, at which point the profile resets and re-anchors to the latest leg. The profile can render either standard volume or delta, giving traders two distinct reads of the same rotation.
Who it's for
- Auction-theory traders working ES, NQ, CL and other liquid futures
- Discretionary scalpers who need real-time HVN and LVN levels inside the live move
- Traders looking for absorption or exhaustion signals without manually redrawing profiles
- OFL users who already think in rotations, swings and balance
- Anyone combining volume profile with delta footprint to confirm trade location
How Leg 2 Leg Profiles works
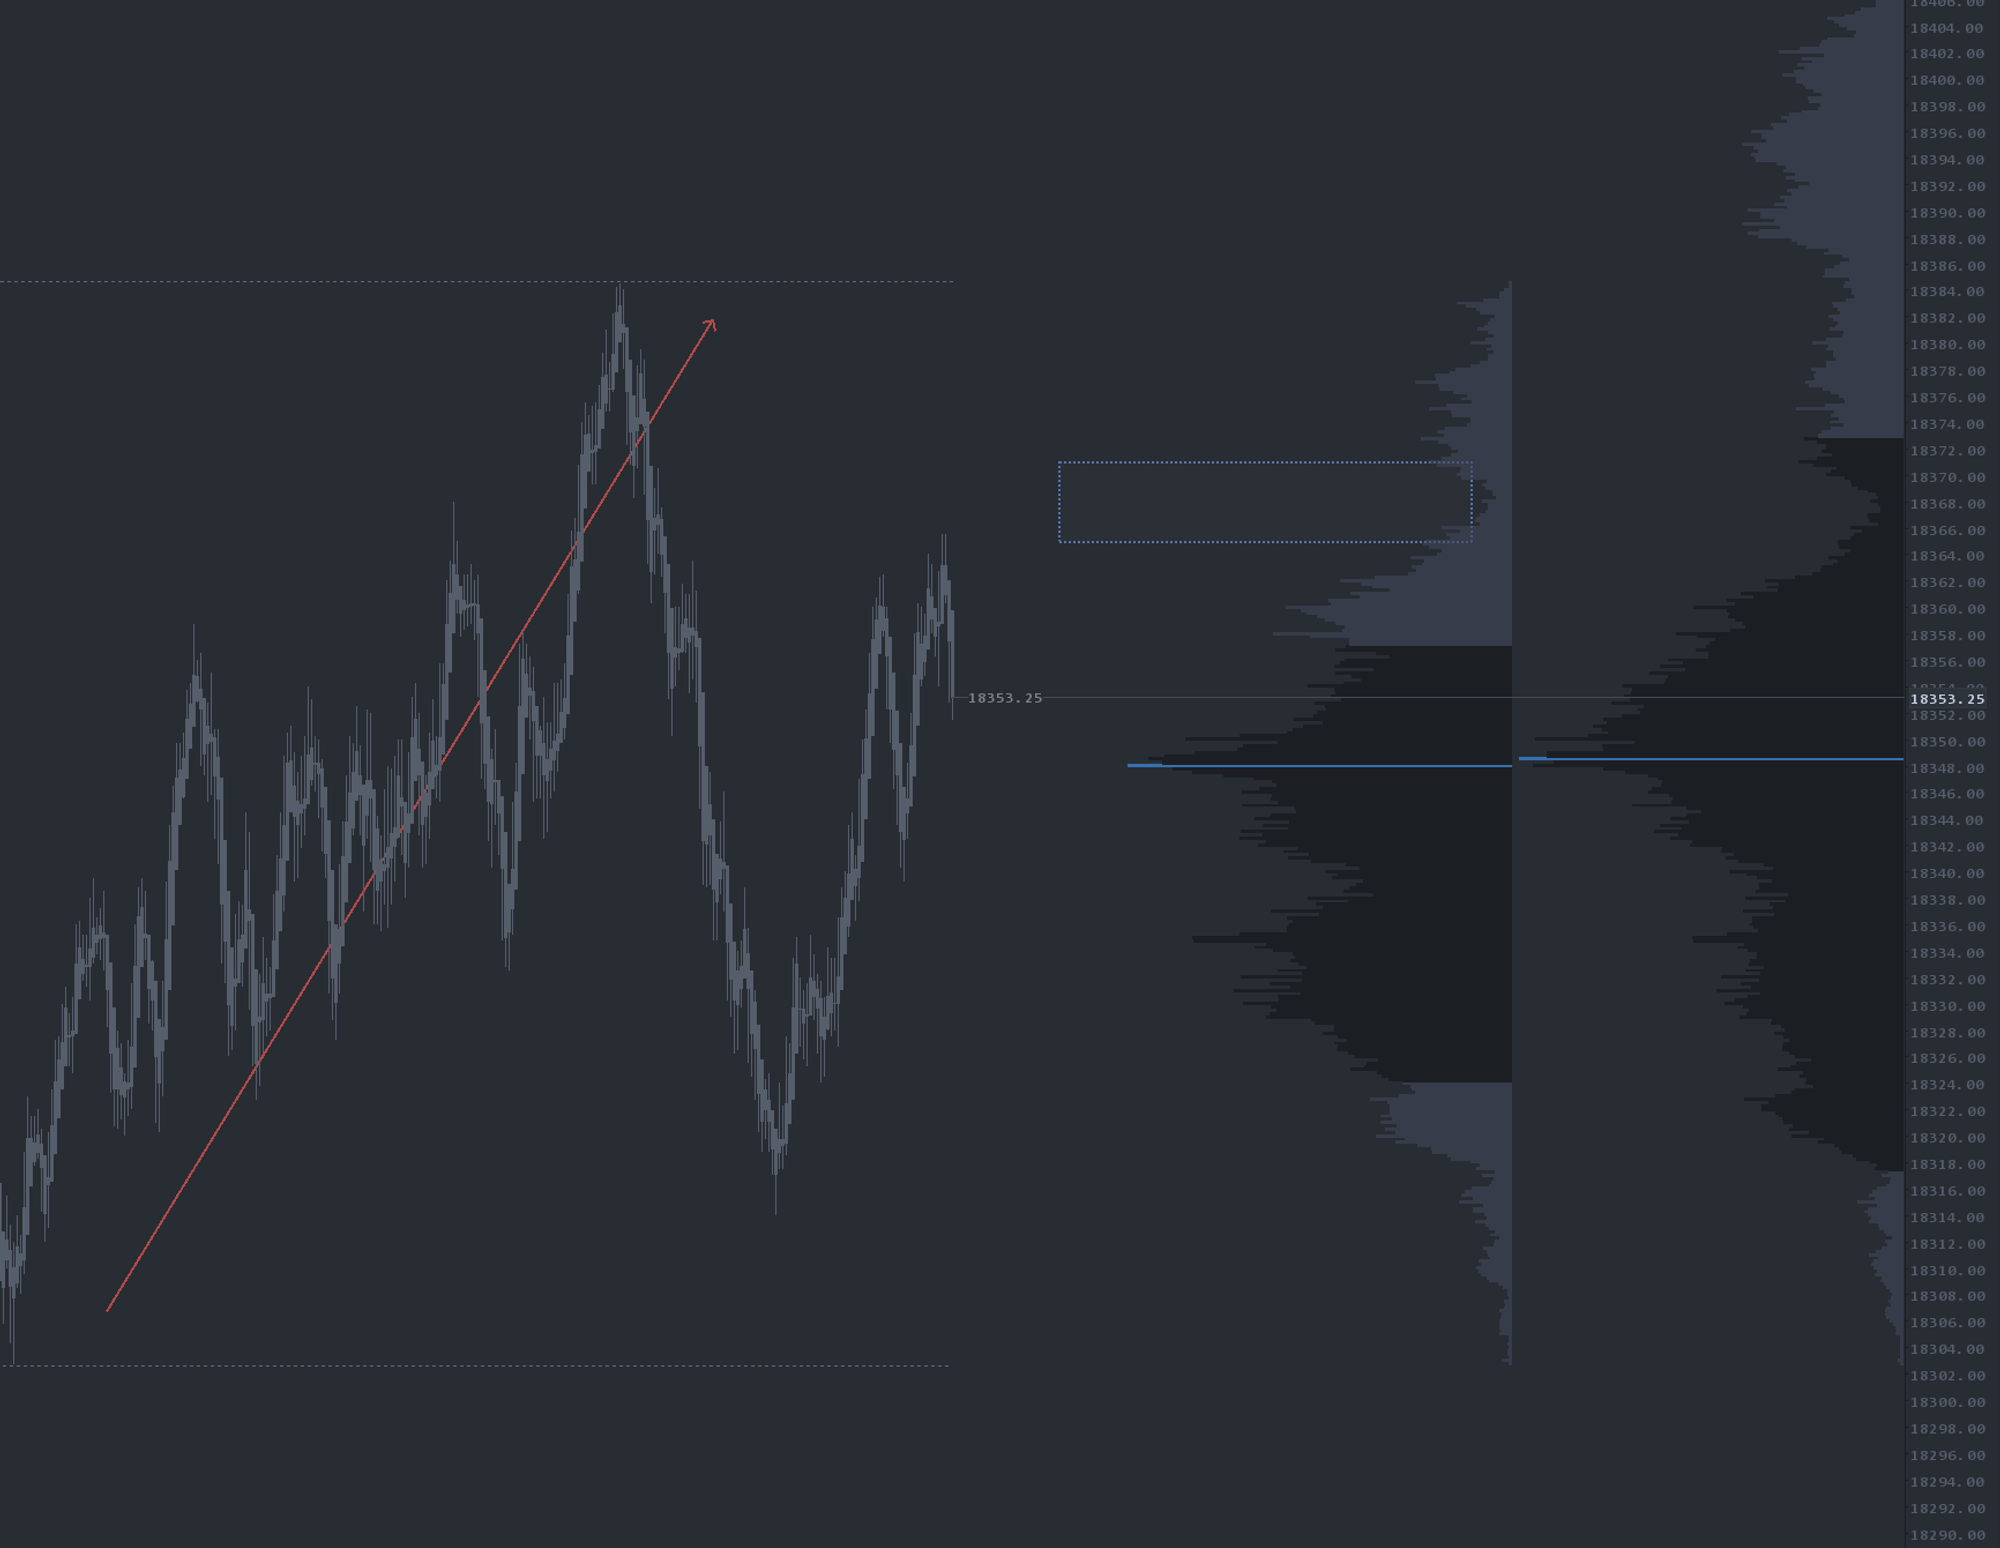
Rotational anchoring
The study uses internal rotation logic to identify the most recent qualifying swing high or low and anchors a profile there. As price extends, the profile widens; as price reverses and prints a new rotation, the profile snaps to the new swing and the previous one is preserved or cleared based on configuration. Because the anchor is rotational rather than time-based, the profile is always relevant to what the auction is doing right now.
Volume mode
Volume mode highlights high-volume nodes (HVNs) — fair-value pockets where price is likely to chop or revisit — and low-volume nodes (LVNs) — thin areas that often act as breakaway zones or rejection points within the current leg.
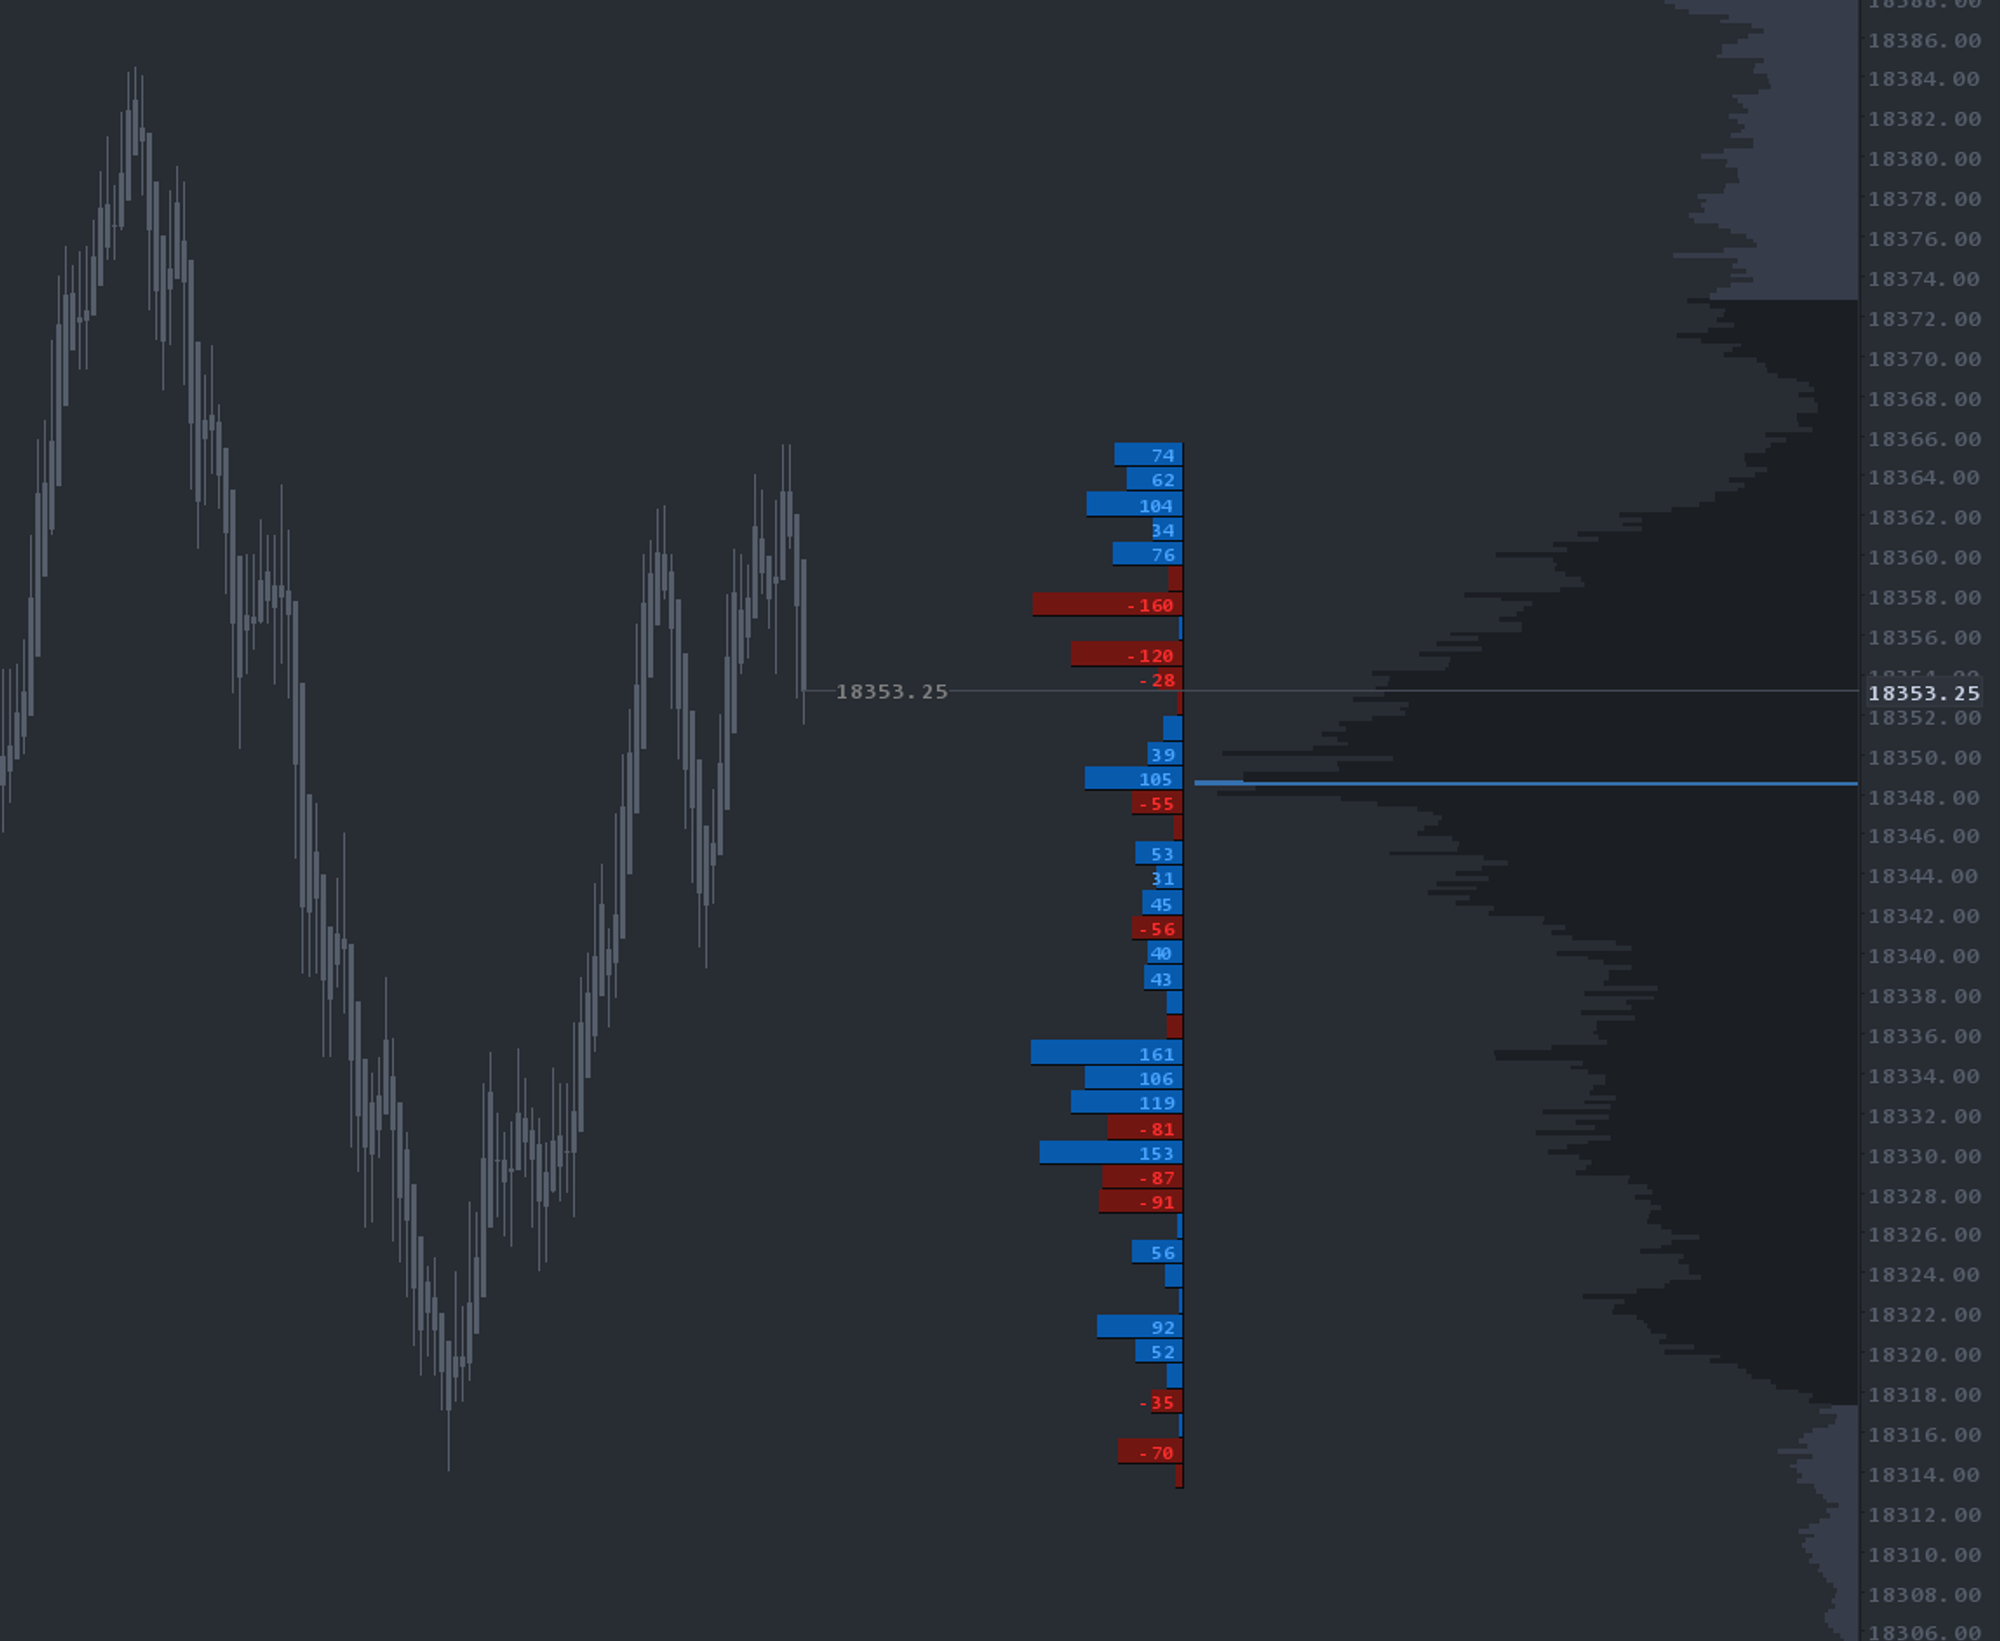
Delta mode
Delta mode swaps standard volume for ask-minus-bid delta. This view is particularly useful for spotting absorption: stacked delta inside an LVN often signals aggressive participants being soaked up by passive liquidity, frequently leading to a counter-rotation. Many traders run volume and delta in stacked panels for a single rotation.
Setup & installation
- Install the OrderFlowLabs package and load the chartbook included with your subscription.
- Apply Leg 2 Leg Profiles to your primary execution chart.
- Configure your rotation sensitivity in the study inputs (tighter values catch shorter swings, larger values isolate macro rotations).
- Choose volume or delta as your display mode — many traders run both on stacked panels.
- Optionally enable VWAP, value area or POC overlays from the study inputs.
Watch the Leg to Leg Profiles setup guide for a guided walkthrough.
Note: Platform-specific videos for MotiveWave, NinjaTrader, and EdgeProX are provided in the Discord.
Example use case
The market completes a full rotation up and starts pushing lower. On the Leg 2 Leg Profile, the LVN inside the new leg lines up cleanly with the LVN of the full session profile — a confluence reoffer area. You mark this as a potential short-continuation zone and look for a new leg lower from price re-testing it.
In the same scenario, switching the study to delta mode shows clear absorption at that LVN — heavy delta with no price progress — confirming aggressive sellers being absorbed before the next leg down. That delta context is one of the reasons traders run both views.