What is Liquidity Zones?
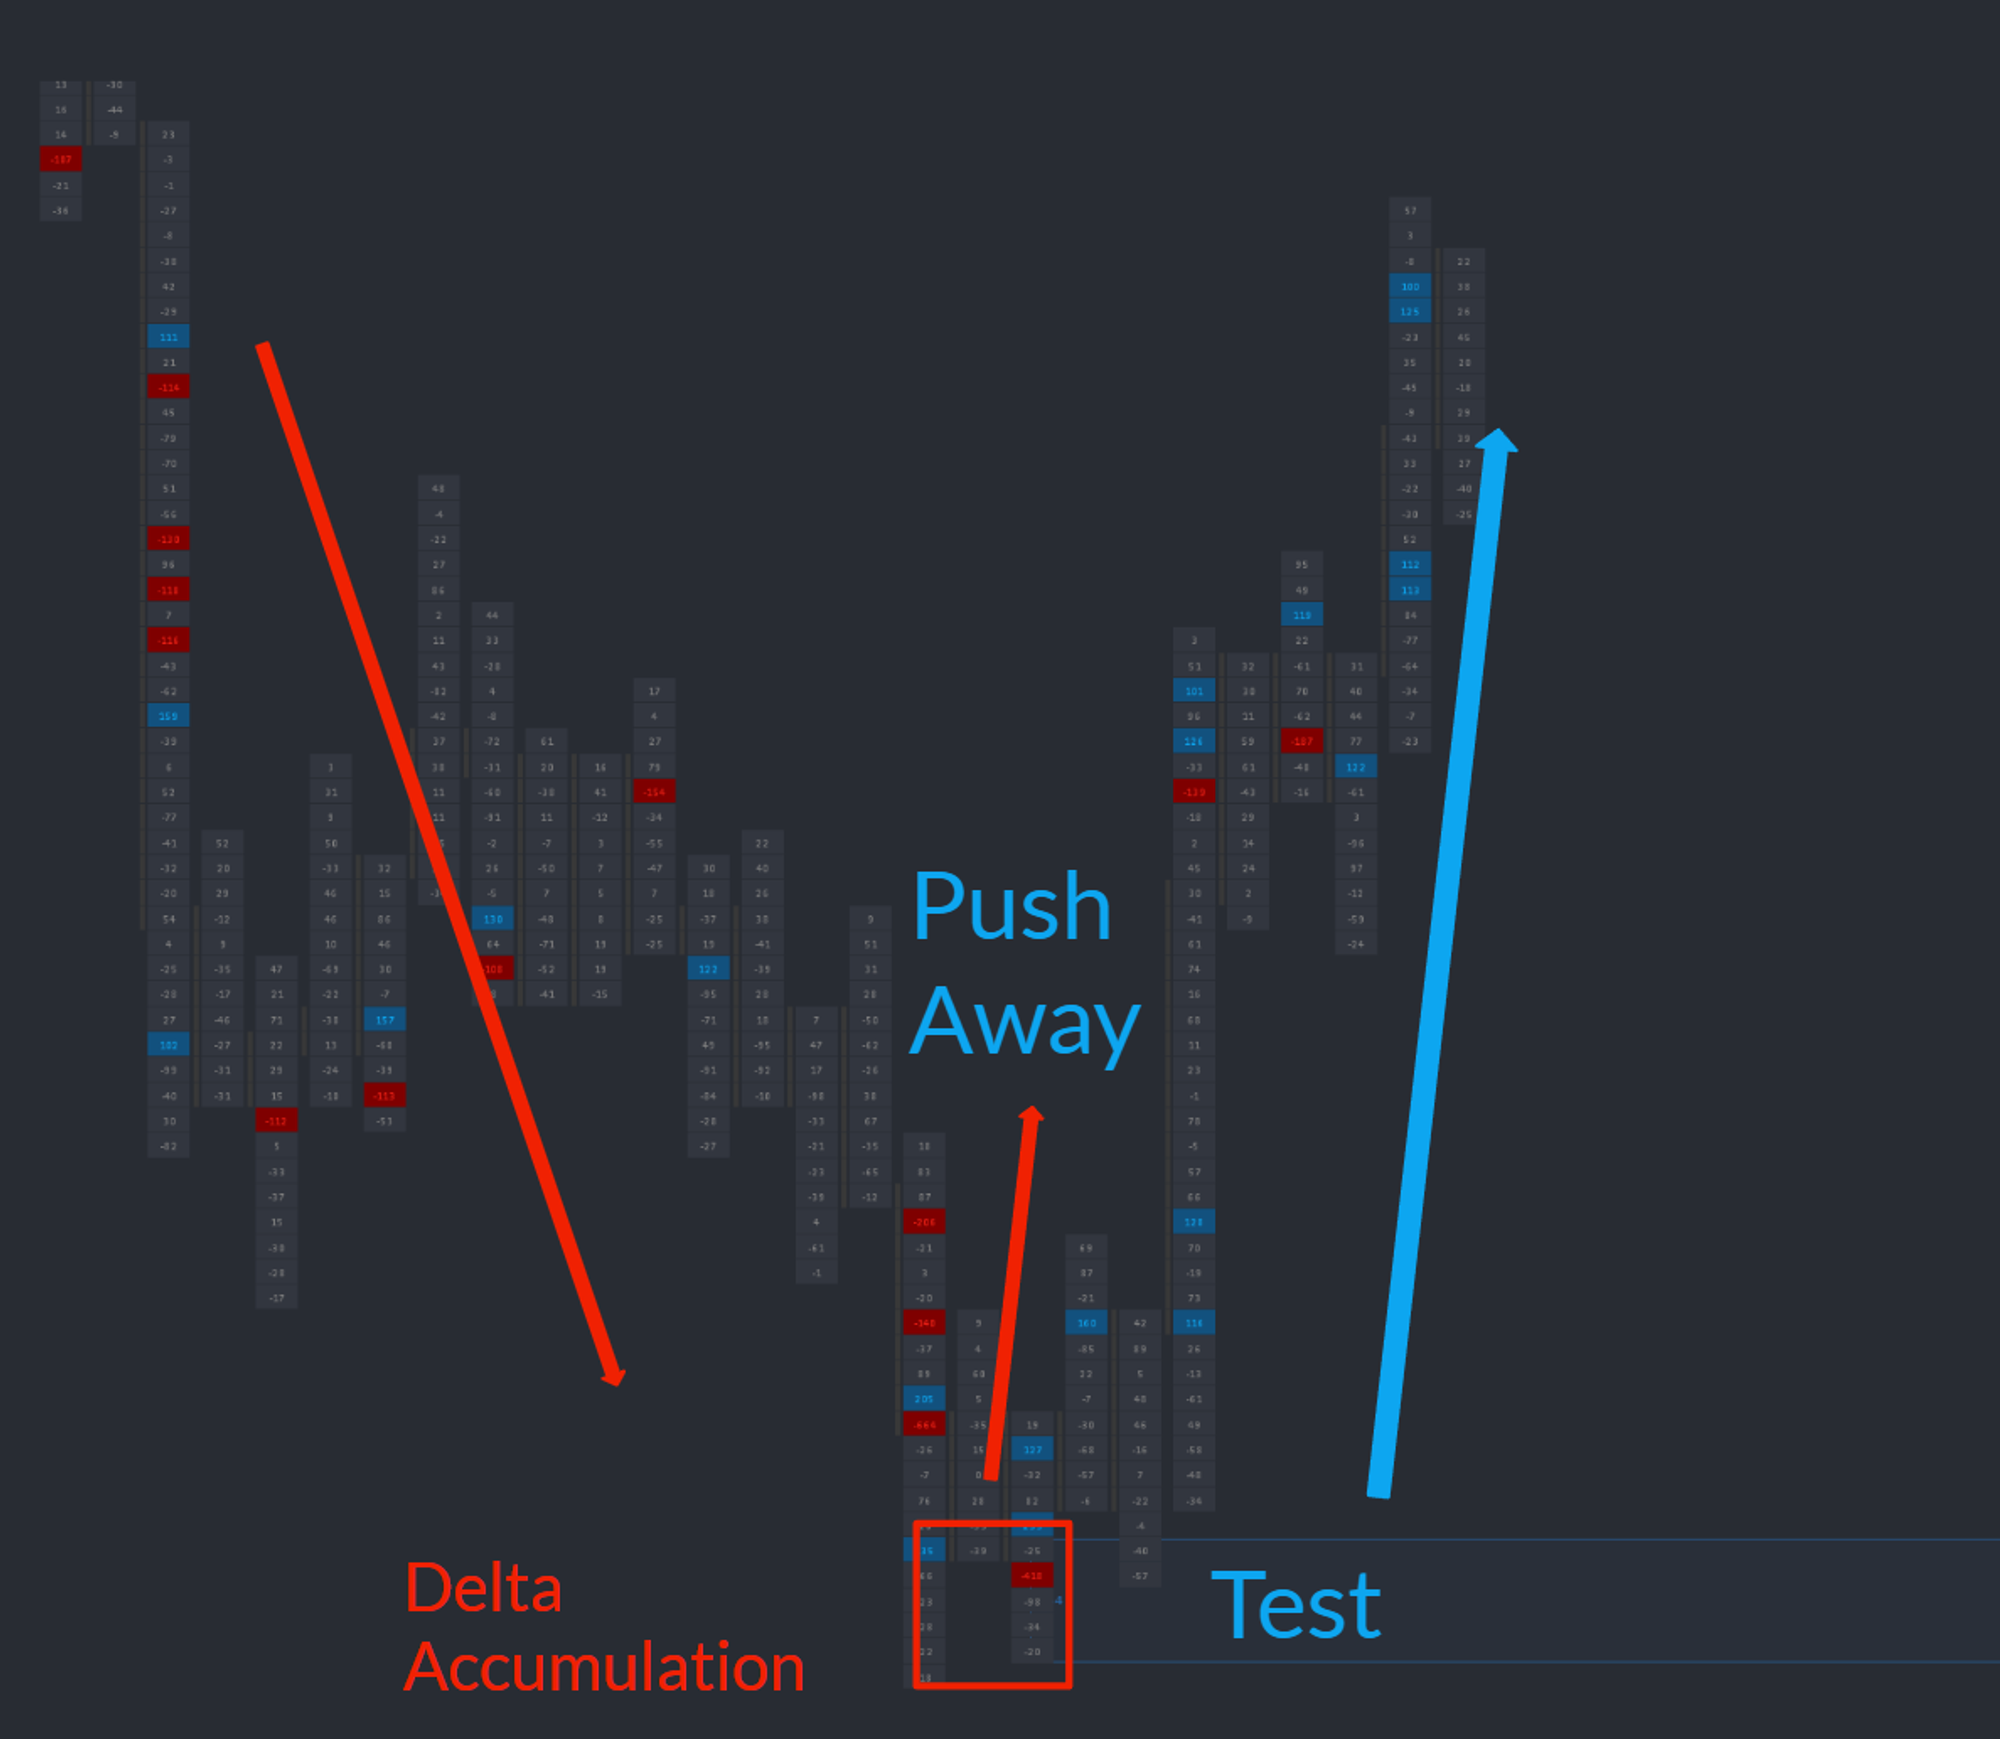
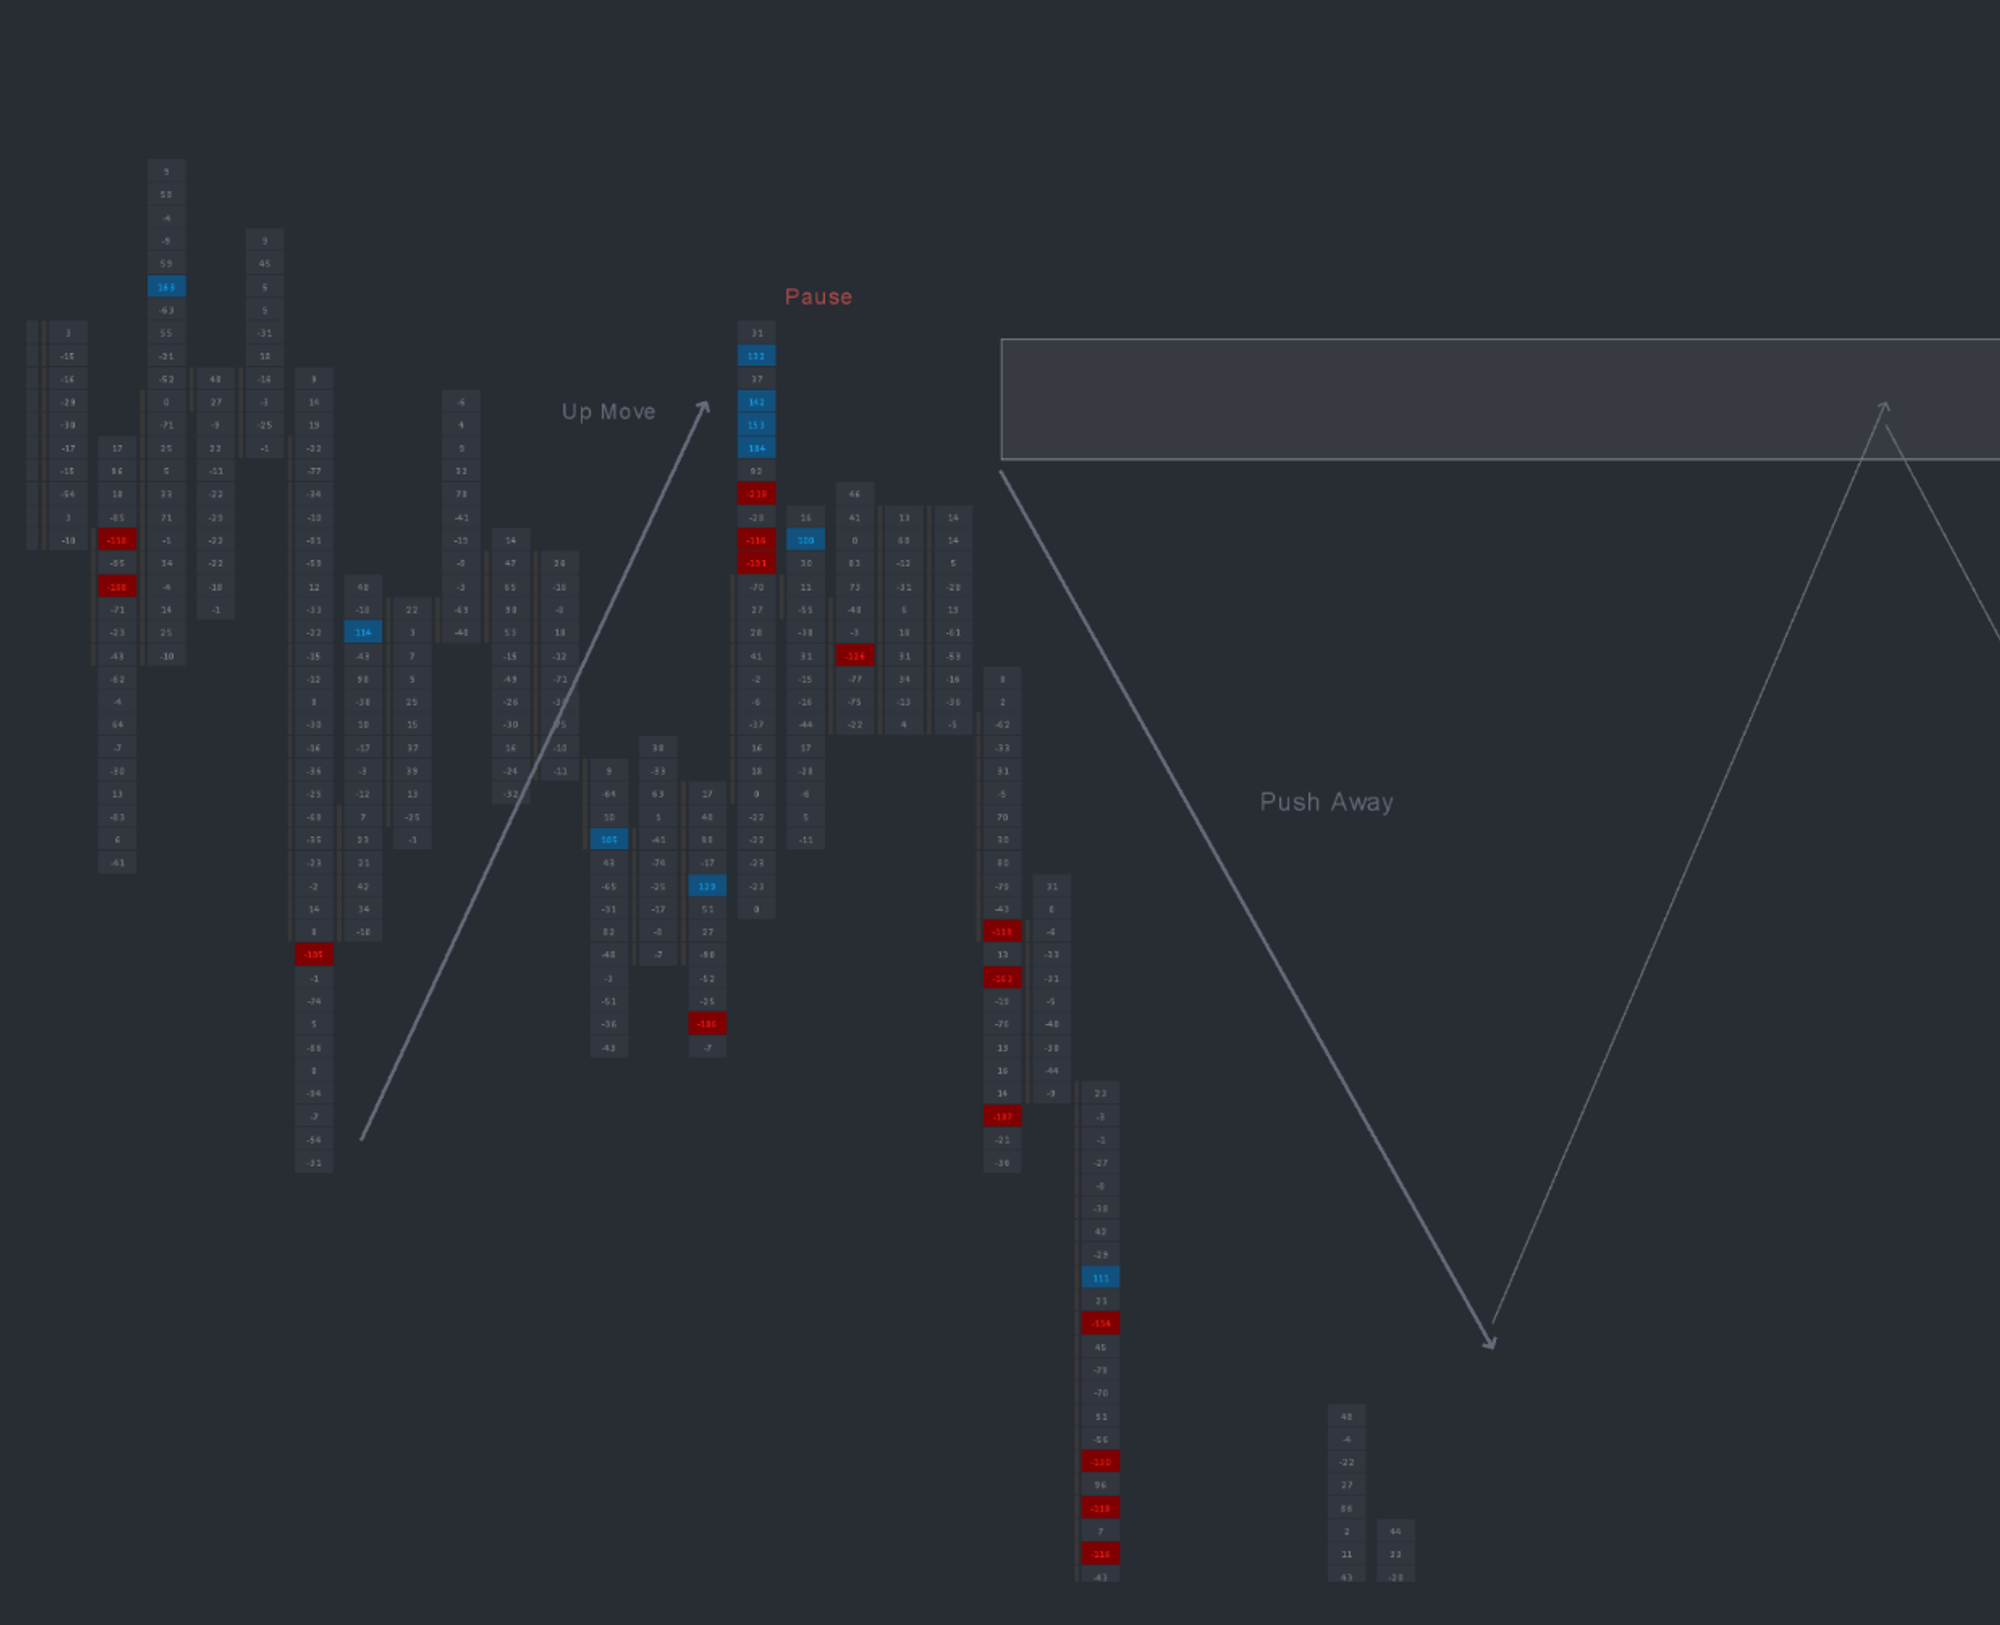
A liquidity zone is a price area where the auction temporarily pauses and may reverse because one or more passive participants continuously refill their side of the book. This behavior — commonly called an iceberg — prevents the aggressor from trading through. The Liquidity Zones study detects this passive activity in real time and plots the zone directly on your chart, so the absorption is documented the moment it happens.
Who it's for
- Order flow traders who fade or join breakouts at absorption levels.
- Discretionary futures traders on ES, NQ, CL, and other liquid CME instruments.
- OFL users who already track DOM and Time and Sales but want absorption auto-marked.
- Traders looking for high-quality retest setups with a defined invalidation level.
- OFL users layering Liquidity Zones with Dominator, EAD, and structural tools like AutoPlot.
How Liquidity Zones works
Continuous scan against delta and price parameters
The study continuously evaluates the auction against configurable delta and price parameters. When the criteria are satisfied — meaning the order flow signature of iceberg absorption is present — a zone is drawn on the chart at the price area where it occurred.
Recommended or custom settings
Traders can either use the OFL recommended settings (calibrated for liquid CME futures) or input their own thresholds via the study settings menu. Custom tuning lets advanced users adapt the study to less liquid contracts or alternative time horizons.
Plan retests, not knee-jerk entries
A printed zone is not an entry signal — it is a documented setup. The high-probability play is a retest. When price returns to the zone, traders should look for an OFL execution tool to fire (such as Dominator or EAD) or use the DOM and Time and Sales to time entry.
Setup and installation
- Install the OFL package in a supported platform of your choice (Sierra Chart, MotiveWave, NinjaTrader, or EdgeProX).
- Apply the Liquidity Zones study to the execution chart on your primary instrument.
- Load the recommended settings, or customize delta and price parameters for your market.
- Layer execution tools (Dominator, EAD) on the same chart for retest confirmation.
Watch the Sierra Chart setup guide: Liquidity Zone Study Installation (Sierra Chart). The chartbook and configuration files are included with the OFL package.
Note: Platform-specific videos for MotiveWave, NinjaTrader, and EdgeProX are provided in the Discord.
Example use case
During the morning session on ES, the Liquidity Zones study draws a zone between 5,210 and 5,212 after detecting iceberg absorption on the offer. Price extends higher, then later in the session rotates back down to test 5,212. As price re-enters the zone, a buy-side Dominator arrow prints and the DOM shows continued passive bids stacking. The trader enters long inside the zone with a stop just below it, targeting the prior session high.