

Delta Map
See exhaustion, absorption, and buyer-versus-seller control directly on the chart instead of decoding raw ask-bid volume.
See the study →Billing cadence
Billed monthly
Couldn't load pickup availability
Cancel from your account anytime. 4.9 on Google
Disclaimer: Testimonials are not indicative of future performance or success.
Subscription terms, up front
Your selected plan renews automatically at the renewal price and interval shown above until cancelled. Cancel from your account before renewal; access continues through the paid billing period.
Our commitment: We have a 4.9 Google Rating because we highly value customer satisfaction. If you're unhappy with our tools for any reason, please contact support to discuss.
New to OFL? Compare the complete plans and platform options before checkout.
Also included: Recap, the trading journal that records itself.
Every OFL subscription includes early access to Recap (recap.trade) — a Windows desktop journal that automatically screen-records each trade from fill to flat and organizes the clips for review. Local-first by design — Recap stores footage on your machine. After checkout, claim access inside the member Discord. Requires Windows 10/11 64-bit and a GPU with hardware video encoding.
OrderFlow Labs Premium Tools is every OFL study plus the members' Discord, on the platform you already trade: Sierra Chart, NinjaTrader, MotiveWave or EdgeProX.
Load the pre-configured chartbook and AutoPlot draws the prior-session levels, balance areas and ranges before the open. When price reaches a level, Delta Map, Dominator and the tape show who's in control, so the read happens at the level instead of after the candle closes. Most members are up and running in under 15 minutes.
What's included:
Platforms: Sierra Chart, NinjaTrader 8, MotiveWave 6 and 7, and EdgeProX. Link your platform in your account dashboard after checkout.
Cancel anytime before your renewal date and keep access until the end of the billing cycle.
Inside the suite
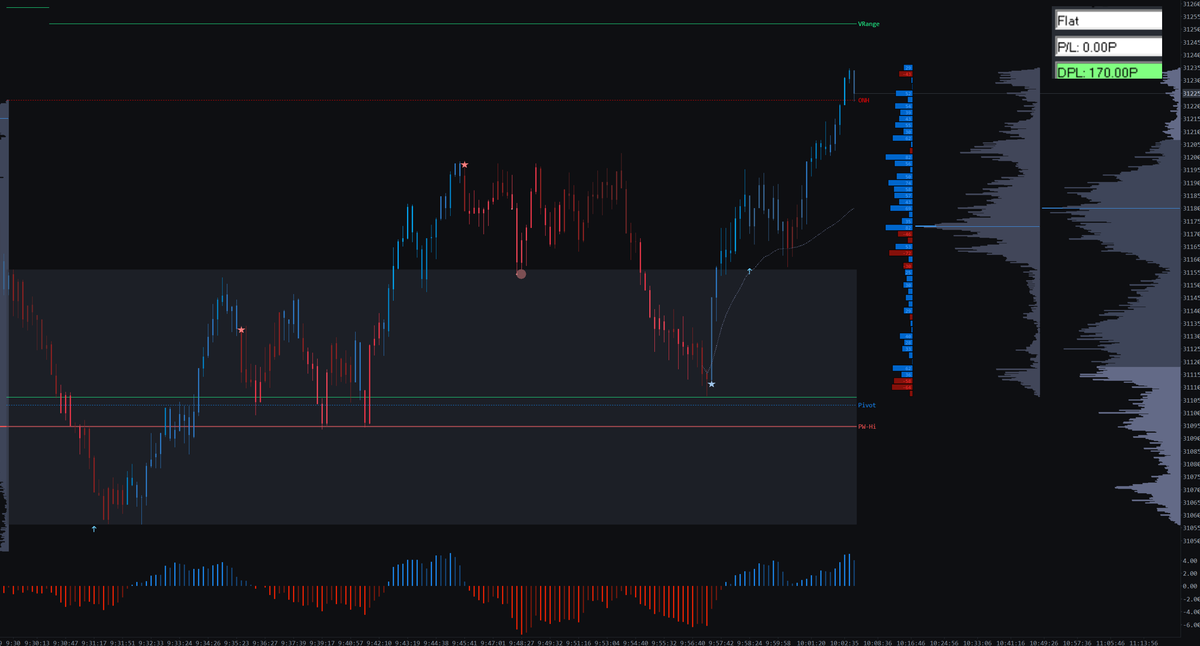
Turn pace, delta, absorption, and volume structure into visual context at the levels you planned.
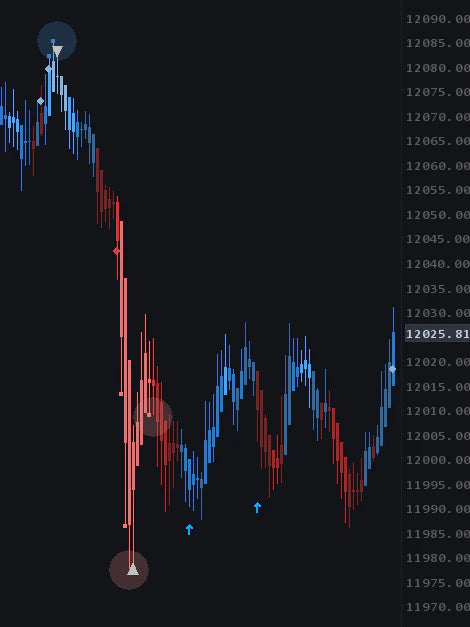


See exhaustion, absorption, and buyer-versus-seller control directly on the chart instead of decoding raw ask-bid volume.
See the study →Spot abnormal buy or sell aggression without mistaking routine activity for a meaningful shift. Dominator compares current pace and size with the same period in prior sessions.
See the study →Get an early visual warning when aggressive momentum begins to fade, giving you context to evaluate a possible rotation at a level you already planned.
See the study →Mark areas where passive participants have absorbed aggression so you can watch the exact zones where the auction previously changed character.
See the study →Keep a volume profile anchored to the current market leg. It resets automatically at each new swing so high- and low-volume areas stay relevant.
See the study →Use a volume-profile-derived line in the sand to frame session bias and potential targets without manually rebuilding the level each day.
See the study →