What are OFL Utilities?
OFL Utilities is a category of practical studies built to complement the core OrderFlowLabs analytics. The bundle includes OFL Overlay (cross-timeframe study overlay), Range Extensions (forward-projecting subgraph fills), SG Zones (locked subgraph-driven rectangles) and OFL Econ Events (economic release panel). They are not standalone trade systems — they make the rest of your workspace cleaner and faster to manage.
Who it's for
- OFL users running multi-chart, multi-timeframe workspaces
- OFL package users who want to project signals like EAD or Dominator across timeframes
- Discretionary traders who rely on pivot, MGI or zone references and want them clean
- Traders who want event-aware charts without leaving their charting platform
- Workspace builders who repeatedly copy chartbook drawings between charts
What's included
OFL Overlay
OFL Overlay lets you take a signal generated on a shorter timeframe — for example a 700 tick EAD print — and overlay that signal onto a longer-timeframe chart such as a 1400 tick chart. This solves a known limitation of the standard study price overlay study, which does not handle this cross-timeframe case cleanly. Watch the OFL Overlay setup guide for the full configuration walkthrough, including when this is and is not the right tool for the job.
Range Extensions
Range Extensions is a charting convenience that takes any two subgraphs containing High/Low values and extends them to the right price axis. The transparent fill style provides two primary benefits:
- Reduce horizontal lines — replace manually drawn levels with auto-extending bands tied to live study output.
- Forward-project current studies — push values from pivot studies, MGI references and similar tools all the way to the chart edge for instant context.
It pairs naturally with the Job Pivots family, MGI Daily/Weekly/Monthly and ODR Zones. Watch the Range Extensions setup guide for the supported subgraph patterns.
SG Zones
The SG Zone Study (Subgraph Zone Study) places an extended rectangle on any supported subgraph from your active studies. A supported subgraph must either have a High/Low value or satisfy a signal/condition at bar close — for example a Job Pinch or color bar alert. Once drawn, zones are invalidated or clipped according to your settings, with options for overlap and intersect behavior so multiple zones coexist cleanly.
SG Zones are rendered as User Draw Tools, which means they can be copied between charts and chartbooks like any drawing — but they are drawn locked to prevent accidental edits. Right-click a zone and select Chart Drawing Properties to modify locked behavior. Watch the SG Zones setup guide.
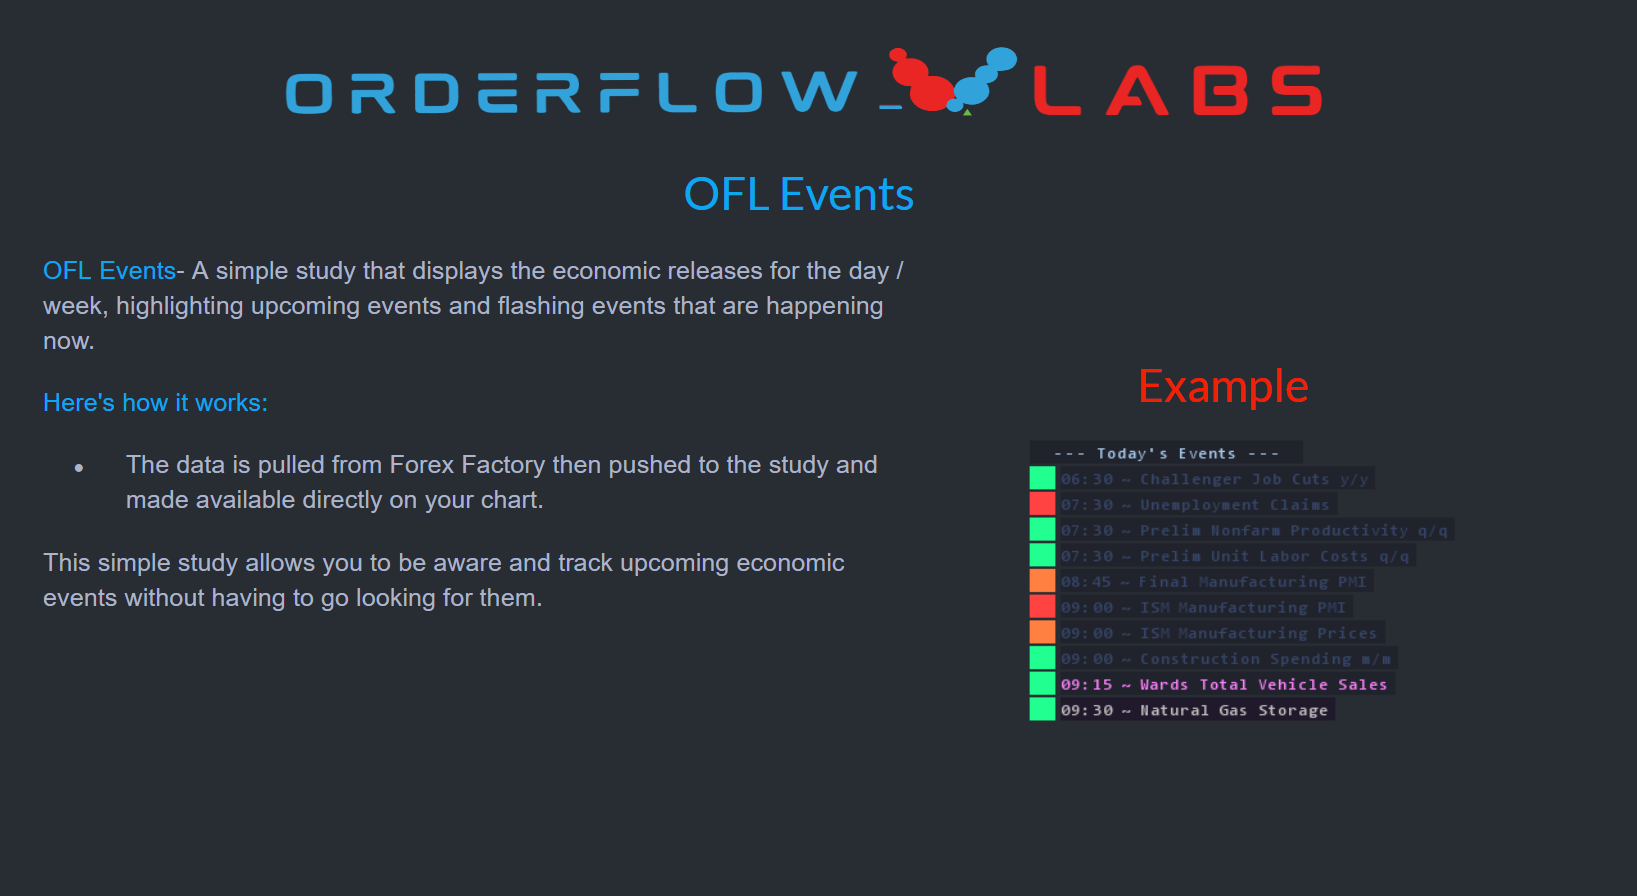
OFL Econ Events
OFL Econ Events is an economic events panel that keeps scheduled releases visible alongside your charts, so you are never surprised by a high-impact print mid-trade. Watch the OFL Econ Events setup guide.
Setup & installation
- Install the OrderFlowLabs package and load the chartbooks included with your subscription.
- Apply each utility independently as needed — none of them require the others to function.
- Map subgraphs (for Range Extensions and SG Zones) to the studies you want them to track.
- For OFL Overlay, configure the source chart and the destination chart timeframe per the setup video.
- Review each utility's setup video before configuring complex multi-chart relationships.
Example use case
You trade off Job Pivots and the Dominator. With Range Extensions, your daily Job Pivot levels project cleanly to the right edge of the chart — no manual lines. With SG Zones, every Dominator print drops a locked rectangle that survives a chartbook copy. With OFL Overlay, you can project a 700-tick Dominator signal onto your 1400-tick execution chart so your higher-timeframe execution chart still respects the lower-timeframe order flow event. And with OFL Econ Events, you know the FOMC release lands in twelve minutes — so you flatten before headline risk hits.