What is VRange?
VRange (Implied Volatility Ranges) is an OrderFlowLabs study available across every OFL-supported platform — Sierra Chart, MotiveWave, NinjaTrader, and EdgeProX. It plots implied volatility ranges for the current session by calculating expected price travel from the index opening price and the VIX (or matching VOL index, such as VXN for NQ), then drawing a framework of dashed range lines and shaded 1x range zones onto the chart. The result is a statistically informed map of where price is likely to pause, reverse, or accelerate as the day develops.
Who it's for
- Futures day traders who want a volatility-based read on the session's expected range.
- ES, NQ, YM, RTY, CL, and GC traders managing risk against implied move targets.
- Order-flow traders who use volatility context to filter trades near range extremes.
- Traders who already pull a CBOE VOL index feed and want it mapped to the chart they trade.
- Traders pairing structural levels (AutoPlot, ODR Zones) with a volatility framework.
How VRange works
Implied volatility framework
VRange takes the index opening price and the matching VIX-family value and projects a set of expected-move boundaries for the session. The primary output is the upper / lower range levels, drawn as green dashed lines, plus shaded 1x range zones representing a full implied move.
Behavior of each level
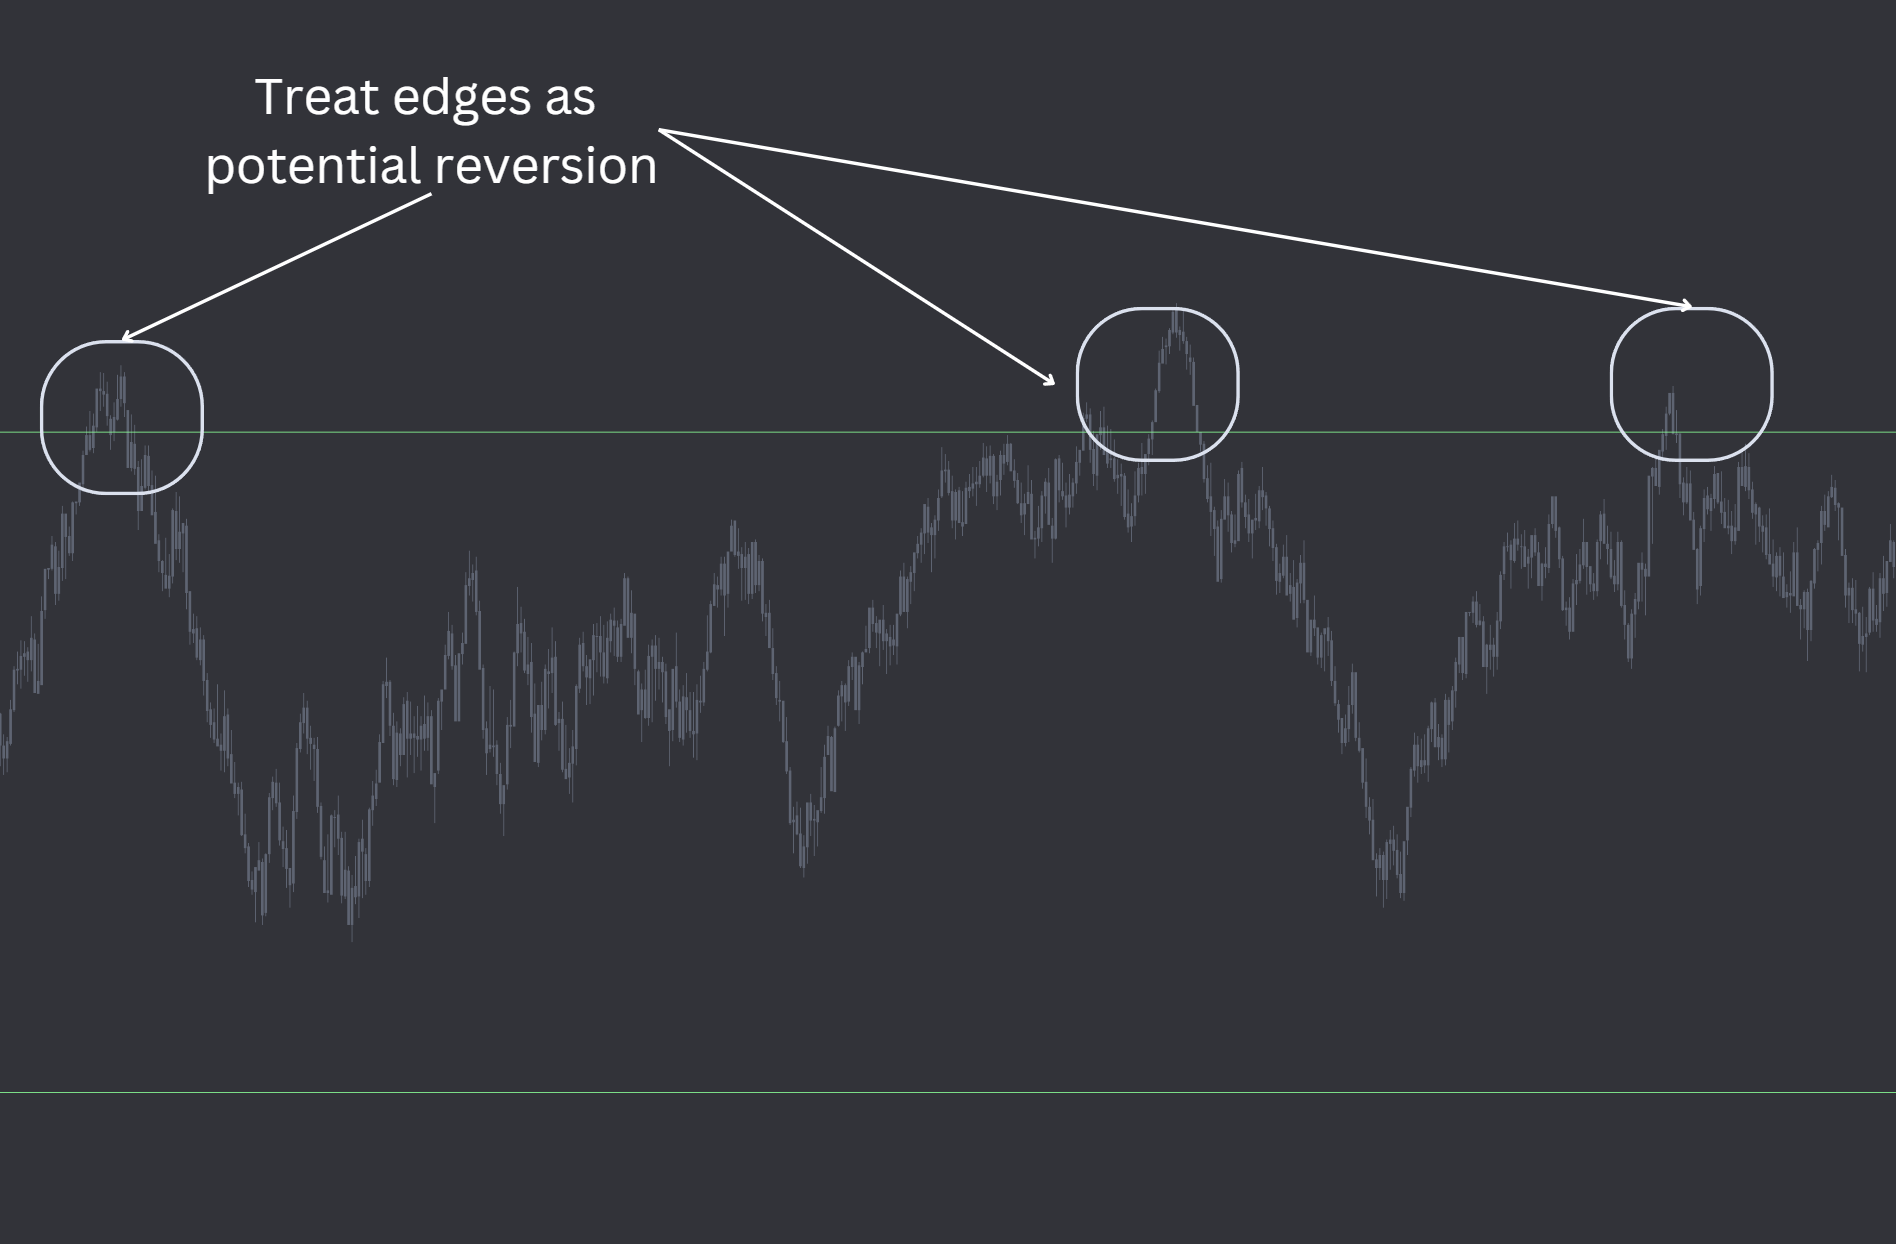
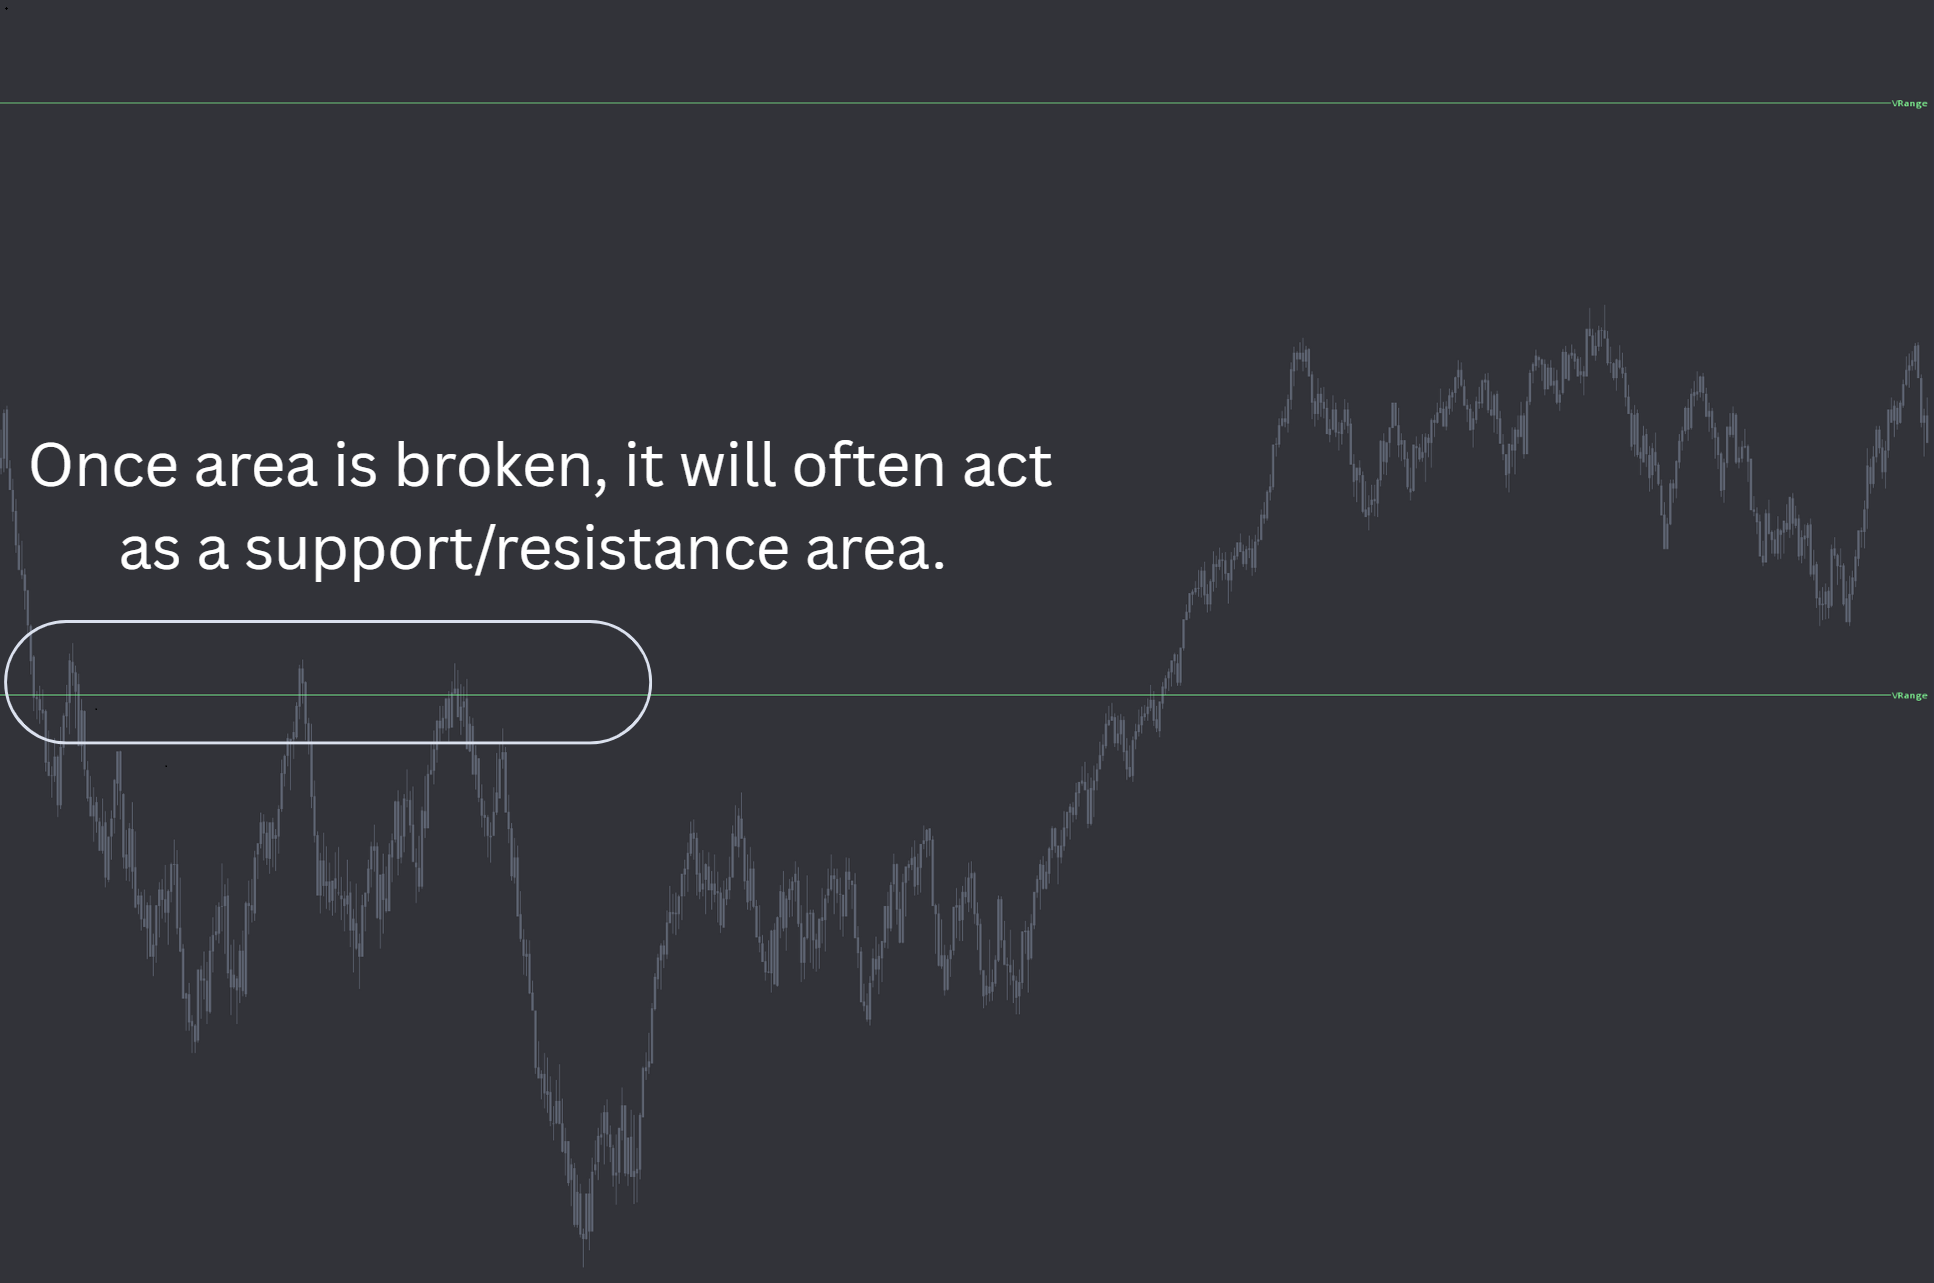
- Upper / Lower Ranges (green dashed lines). These often act like value boundaries — points of mean reversion when defended, and flips to support or resistance when broken with conviction.
- 1x Range Zones. Shaded zones representing a full implied move for the session. They are not hit every day, but when price reaches them they tend to behave as inflection points on trend days or magnets on expansion sessions.
VIX source: chart or manual
VRange accepts the volatility input two ways. In Chart mode the study maps directly to a loaded VOL index chart (for example, VIX for ES or VXN for NQ). In Manual mode you enter the volatility value at each reset period, which is useful for testing or working in a chart layout that does not include a live VOL feed.
Recalc modes
VRange resets at session boundaries:
- Globex Open & Pit Open — resets each Globex Open and each RTH Open. Recommended.
- Globex Open — resets at Globex Open only.
Globex Open & Pit Open is the recommended mode for most index futures workflows.
Setup and installation
- Install the OFL package in a supported platform of your choice (Sierra Chart, MotiveWave, NinjaTrader, or EdgeProX).
- Apply VRange to a time-based DND chart — 1-minute or 5-minute bars work well. Populating the study on a non time-based chart will produce inconsistent results.
- Activate the CBOE Global Indexes Data Feed in your platform and load the VOL index chart that matches your traded contract.
- Configure the Vix Source (Chart or Manual) and Recalc Mode for your workflow.
Chart and study settings
| Setting | Recommended value | Notes |
|---|---|---|
| Chart type | Time-based DND chart | Required base chart for the study |
| Bar period | 1 or 5 minutes | Either is supported |
| Data feed | CBOE Global Indexes | Required for automated VOL calculations |
| In1 — Pit open time | Pit open of the index being traded | Drives RTH reset |
| In2 — Vix Source | Chart or Manual | Chart maps to the VOL index chart; Manual uses In3 |
| In3 — VIX value (manual) | Current VIX-family value | Used only when Vix Source is Manual |
| Recalc Mode | Globex Open & Pit Open | Recommended; resets at both session opens |
| In4 / In5 / In6 — Multipliers | Defaults | Pre-tuned; override only if testing alternative ranges |
| Remove Old Subgraphs | Yes / No | Clean up prior session levels or keep them on chart |
Symbol mapping (CBOE Global Indexes)
| Index | VOL symbol |
|---|---|
| ES | VIX_CGI |
| NQ | VXN_CGI |
| YM | VXD_CGI |
| RTY | RVX_CGI |
| CL | OVX_CGI |
| GC | GVZ_CGI |
Watch the VRange Sierra Chart setup video for the full walkthrough. A configured chartbook is included with the OFL package.
Note: Platform-specific videos for MotiveWave, NinjaTrader, and EdgeProX are provided in the Discord.

Example use case
ES gaps higher and the upper green dashed level is sitting just above premarket highs. Price drives into it on the open and stalls; you watch order flow for absorption or delta divergence and treat the level as a mean-reversion zone. Later in the day, momentum returns and price closes back through that same level with conviction — you now treat it as a flip from resistance to support and look for a continuation long on the retest. If the move keeps pressing into the 1x upper range zone, you raise the bar on new longs: you are now in expansion territory, and the zone is more often an inflection than a continuation.