
"Where's the Bottom?" - My Favorite Day Trading Clue
Guest Blog Post By: HorseLoverFat
I want to spend a few moments discussing an important topic for day traders: Identifying bottoms and/or points of relief during a selloff. This topic is especially important given our current high volatility environment where +/- 1%-2% daily swings are common. As a day trader, these volatile periods make for excellent trading and scalping, but it’s incredibly important to be able to recognize when the momentum is likely to change…especially if you’re short. Personally, I love trading on the short side but I’m well aware the bull market we’ve all been trading for years loves to punish shorts. To be a well-rounded day trader, I believe you’ve got to refine your strategies for trading on the long side and short side…and those strategies are not the same. So for this article, I’m going to discuss what I have found to be one of the best clues to identify an intraday bottom where it makes sense to cover your short trade—or go long if you’ve got a few screws loose.
One of the questions I get asked the most is “How do you know when to take profits and get out of a trade?” It’s a great question, and one that I ask every trader I interview because I find the answers fascinating. Everyone does it differently. For me, the answer to that question depends on a lot of things; there’s no single cut-and-dry answer. Market volatility is a huge factor for me. What is the VIX telling us? Are large moves expected? If so, I’m inclined to hold smaller winning positions longer.
Let’s look at an example:
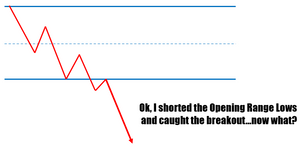
Say we caught this Opening Range Low breakout short and there’s no obvious levels of Support/Resistance nearby, no VWAP, no key moving averages…nothing: How do I know when to take profits? Allow me to introduce one of my favorite clues to watch for a potential bottom/reversal…I call it: The Hand of God
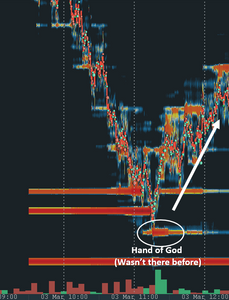
Cheesy name, right? I know, but you’ll remember it. So what is the Hand of God? It’s a large order that hits the book during an aggressive selloff just below current price. It cannot be a large order that was already on the book. This is a key distinction. Large resting limit orders are often magnets for daily price action; however, the Hand of God order is different—it appears out of nowhere and “cradles” price during aggressive selling. Here’s a couple nice examples from ES_F yesterday:
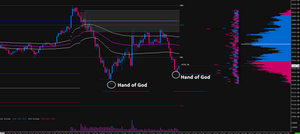
View from Bookmap
As we can see from the examples, a large participant is stepping in on the bid just below price. Why? I don’t know, they want to buy? Who knows…but also who cares? What matters is what happens after we see these orders appear. Time and time again, price moves aggressively away from this order. Don’t take my word for it, research it yourself, but I can tell you it’s absolutely one of the best ways I’ve found to gauge when the tides are turning and when an intraday bottom is being put in. It's important to note the Hand of God order may not necessarily mark the bottom for the entire session (although you’d be surprised how often it does); it’s entirely possible price continues down past the level where the large order rests later in the session. After all, this is trading—anything is possible. But because this is trading we have to think in probabilities and the Hand of God order has a high probability of marking a temporary bottom or turning point. Again, I challenge you to start watching it for yourself, that’s the best way to develop confidence in any setup. That’s also the only way to spot it: You simply have to be watching. You’ll need trading software capable of spotting this activity—some people use their DOM, but I prefer Bookmap Pro and Sierra Charts for this. Regardless of what software you use, I cannot stress this enough: The Hand of God order has to appear out of thin air right below current price during a selloff to have validity. Old resting orders do not produce the same repelling effect. Don’t be fooled; learn to spot the difference.
I’d be lying if I said I don’t sometimes Flip ‘n Reverse my position when I see the Hand of God…because I’m absolutely guilty of doing that. However, it should be understood that this is an incredibly risky play and not advised. You’re far better off using the Hand of God as an indicator to book profits on your short and call it a day or wait for a better short entry…flipping to the long side is essentially swimming upstream and fighting momentum is asking for trouble as a day trader.
Final note: In my experience, this phenomenon seems to be most reliable when the selloff is persistent but NOT violent. There’s a difference. Velocity of price matters here. If the selloff is aggressively violent with price skipping through several points at a time then the Hand of God reversal is less reliable. And obviously, if you see a large Hand of God order hit the book below price and the sellers immediately push through it well then it wasn’t actually a Hand of God order lol. You’re looking for the order to hit the book and price immediately moves away from it.
Hope this helps! Horse