
Volume Builds
As intraday traders it's easy to be blinded by viewpoints based on timeframes that are irrelevant to the needs of the current session. It's just as easy in hindsight to say "trust your analysis" or "trust your plan." What does that really mean with regard to the activity that's actually present?
A directional price move must be met with volume — interest. So when price moves and builds volume, the activity needs to be respected until it changes. Rather than offering philosophical takes on price and volume that can't be executed on, let's dive deeper.
The Concept: Volume Builds Equal Interest
I've stated the following via Twitter:

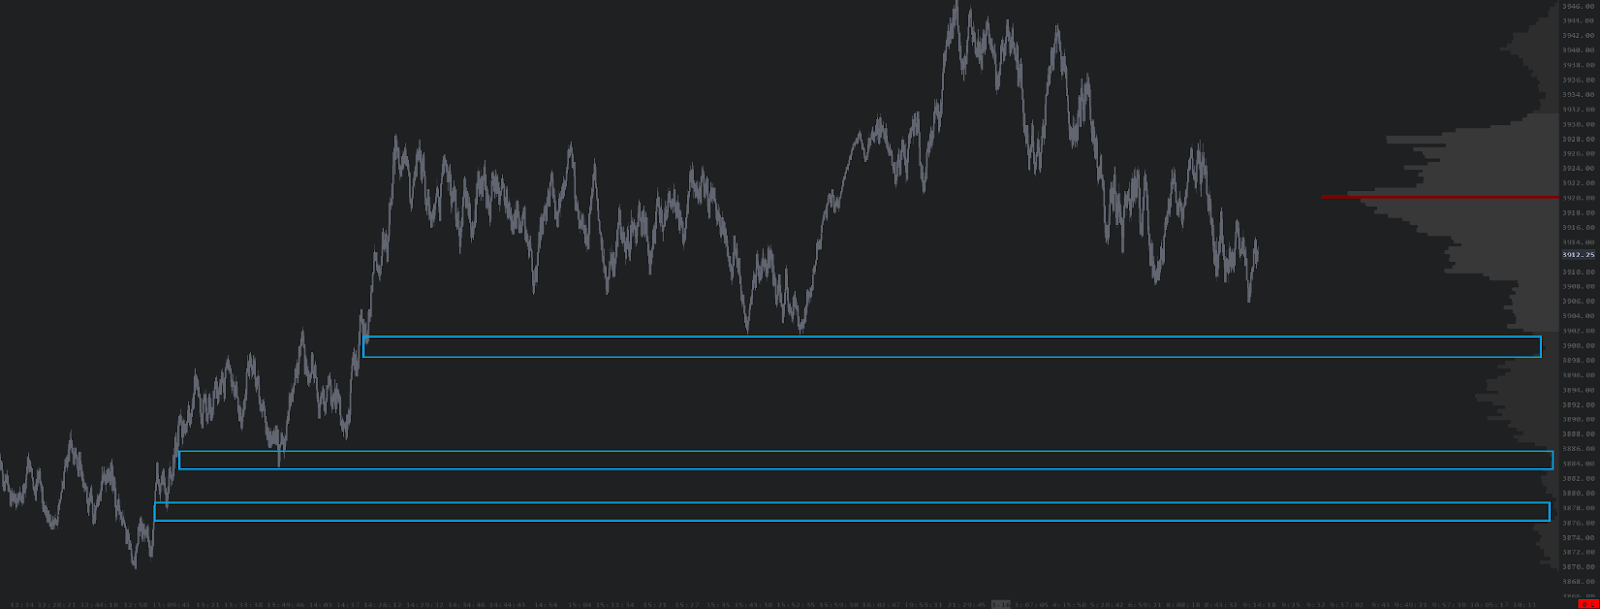
The initial tweet says, "If you draw a volume profile on the dominant leg of price action and the volume continues building nodes (high volume areas of interest), 'she ain't done'."
What this means is that the price range around the High Volume Node (HVN) is temporarily becoming accepted, as long as activity stays inside the boundaries of that distribution. So, what are the boundaries? Those are the low volume areas — the Low Volume Nodes (LVNs) — surrounding the volume build. Unless initiative activity breaches the LVN out of the distribution, you have a structural reference for rebid/reoffer activity. For more on the underlying concepts, see the Volume Profile guide.
Drawing a volume profile from the dominant leg is based on the timeframe of interest. Within the intraday session, the auction can change hands multiple times — think TPO (30-minute high and low).
A Framework for Reading Volume Builds
From here, let's build a framework:
- Is volume building and creating a high volume node?
- Is price staying within the high volume node of the current build?
- If price escapes, what does that mean?
- How can this information be utilized in a live trading environment?
These four questions are the through-line for everything that follows. Each one keys off the same structural reference: the HVN as the area of acceptance, the LVNs as the boundaries. Get those right and you have an objective read of where the auction is and what it's doing.
What Happens When Price Escapes
Once price stops respecting the LVNs behind the direction of the trend, the auction has begun to seek a temporary balance. From there, a trader can use the session's structure to gauge an ideal entry location and to manage risk. In this situation — leaving a volume build (HVN) and initiating against the trend by traversing the most significant LVNs that led into the move — intraday traders can then assess a reversion entry on a retest of the LVNs that were traversed. This is the same structural read that drives the liquidity zones setup.
As the referenced tweet says, "Say you have a node and the auction returns above (or below based upon the direction of the auction leg) the LVN into consolidation. The LVN now turns into a key inflection." Respecting the LVN means the leg is done — at least for now.
One Time Framing in TPO
One Time Framing is a concept within TPO (Time Price Opportunity, 30-minute) charting used to describe the direction of the market's trend. For more on TPO charts, see the Market Profile post.
In a One Time Framing uptrend, the market forms a series of higher highs and higher lows, without any significant pullbacks or reversals. This indicates that the market is consistently making new highs and that the bullish trend is strong and sustained. (This is an example of an auction leg up.)
Similarly, in a One Time Framing downtrend, the market forms a series of lower lows and lower highs, without any significant rallies or reversals. This indicates that the market is consistently making new lows and that the bearish trend is strong and sustained. (This is an example of an auction leg down.)
The concept of One Time Framing is useful both for gauging strength of the move and for spotting a change of hands in the auction. Traversing a prior period low or high becomes significant when used in conjunction with the volume profile, and gives you context clues in an execution sense.
Live Application Examples

For the basics of this understanding, check out two simple explanations here: