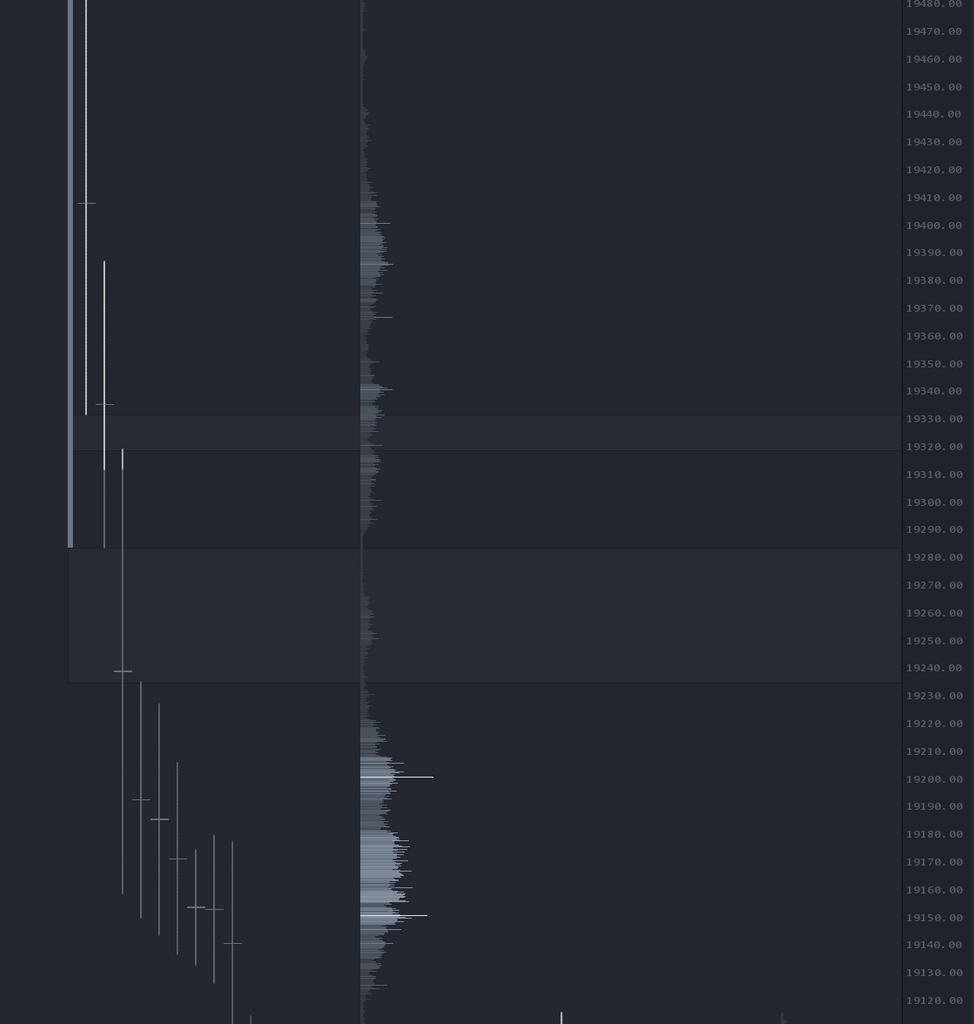
Market profile, or TPO charts, essentially organize a 30-minute candle chart by using letter sequences to represent each 30-minute period. For example, the RTH open starts with the letter "A," then 30 minutes later, it moves to "B," and so on.
A single print is a period where there's no overlap with prior periods, and it tells us a lot. In simple terms, an auction with single prints indicates a strong push from one side of market participants. These participants are either emotional, incredibly confident, or have no choice but to act. While we don’t really care why or who is moving the market in one direction, what we do care about is how to use this information to our advantage.
Jim Dalton has said, "The worst thing a trader can do is not believe a trend day," meaning that if the market is trending, you’ll get run over trying to trade against it. I’d also argue that many retail traders default to mean-reversion strategies—and for good reason. The market spends more time in balance than trending, so it makes sense to lean on mean-reverting strategies. But by focusing solely on mean reversion, you risk getting steamrolled on trend days or missing out entirely, since you have no strategy for when the market is trending.
Back to the point. Single prints give us a clue that the market is trying to trend. This happens when aggressive participants are pushing the market in one direction. Let’s look at some numbers:
Out of the past 717 trading days, 376 had single prints, meaning 52% of days showed the market trying to trend. Of those 376 days, the trend held 274 times—that's 72% of the time the market held in the direction of the single prints, meaning they weren’t traded through, and we closed in that direction. That’s a pretty strong argument against fighting a trend day with single prints.
Now, let's go a step further. Of the 376 days with single prints, 102 days had SP failures, meaning the prints didn’t hold. That’s 27% of SP days. But, interestingly, even on those failed days, the original trend continued by the end of the session 43 times. This describes a day where a trend started, failed, and then resumed in the original direction.
There were 59 days where the trend completely reversed, meaning the market tried to trend, failed, and then traded the entire day’s range, closing in the opposite direction. That’s just 15% (59 out of 376 days). So, if you’re going to fade a trend move, understand that you’ll likely get punished most of the time. This isn’t putting the odds in your favor.
In my own trading rules, I don’t fight a day with single prints. You could even use some of this data to exploit these moves by developing an approach that takes advantage of a strong auction instead of resisting it.
The data I’ve shared is for NQ between April 2021 and January 2024, based on my own visual inspection (yes, I went through each day and logged the details). Do your own homework, but my biggest takeaway was how often these conditions occur—about 2.5 times per week on average.
Summary
The main point of this exercise was to give you enough evidence to support my rule: don’t fade a day with single prints. Many traders lean toward mean reversion strategies, but the data shows that trending days with single prints are not to be fought.
The secondary point is that you can use the presence of single prints to your advantage. These days wipe out more traders than any other. This doesn’t mean you should immediately go long or short when you see single prints, but it does mean you can use this data to build a framework—if you don’t already have one—for how to capitalize on these days. Look for minor pullbacks for continuation, liquidity zone stacking, or a simple retest of support/resistance flips.
Ultimately, if trend days usually cause you problems, the first step is to sit back and avoid trading when you see single prints. Once you’ve built that mental discipline, you can start developing strategies to capitalize on these trends.

